آخر المواضيع المضافة


 تاريخ الرياضيات
 الرياضيات في الحضارات المختلفة
 الرياضيات المتقطعة
 الجبر
الجبر
 الهندسة
 المعادلات التفاضلية و التكاملية
 التحليل
 علماء الرياضيات
 |
Read More
Date: 18-10-2018
Date: 22-11-2018
Date: 14-10-2018
|

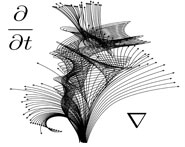
A Pólya plot is a plot of the vector field of ![(R[f(z)],-I[f(z)])](http://mathworld.wolfram.com/images/equations/PolyaPlot/Inline1.gif) of a complex function
of a complex function  . Several examples are shown above.
Pólya plots can be created in the Wolfram Language using the following code:
  PolyaFieldPlot[f_, {x_, xmin_, xmax_}, {y_, ymin_, ymax_},
    opts : OptionsPattern[]] :=
   VectorPlot[Evaluate @ {Re[f], -Im[f]},
     {x, xmin, xmax}, {y, ymin, ymax},
     VectorScale -> {Automatic, Automatic, Log[#5 + 1]&},
     opts
  ]


|
|
|
|
دخلت غرفة فنسيت ماذا تريد من داخلها.. خبير يفسر الحالة
|
|
|
|
|
|
|
ثورة طبية.. ابتكار أصغر جهاز لتنظيم ضربات القلب في العالم
|
|
|
|
|
|
|
قسم شؤون المعارف ووفد من جامعة البصرة يبحثان سبل تعزيز التعاون المشترك
|
|
|