


 تاريخ الرياضيات
 الرياضيات في الحضارات المختلفة
 الرياضيات المتقطعة
 الجبر
الجبر
 الهندسة
 المعادلات التفاضلية و التكاملية
 التحليل
 علماء الرياضيات
 |
Read More
Date: 29-12-2021
Date: 16-1-2022
Date: 9-1-2022
|
It is common to illustrate sets and operations on sets by diagrams. A set A is represented by a circle, and it is assumed that the elements of A correspond to the points (or some of the points) inside the circle. Such an illustration is called a Venn diagram; diagram methods were first used by Leibniz and Euler, but George Venn used the diagrams extensively and he formalized and unified diagram methods.
Elements common to two sets are shown in both corresponding circles, and the intersection of two sets is represented by the intersection of the two circles. For example, suppose A is the set {1,2,3,4} and B = {3,4,5,6,7}, then A and B would be shown in a diagram as follows:
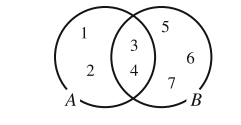
The intersection of the two circles contains the elements of A∩B = {3,4}.

This same method can be used to represent more general sets. The diagrams in Fig. 1.1 show Venn diagrams representing A∪B, A∩B, AB and BA; in each case, the set represented is shown by the shaded area. We do not know the individual members of the sets, but they could be represented by points in the diagram if they were known.
Venn diagrams are used to calculate the numbers of elements in sets. We write the numbers of elements in the areas of the diagram, instead of the elements themselves.
Sometimes it is useful to represent objects that are not in any of the sets, so we usually show an outside area, represented as a rectangle, and write the number of other elements in there.
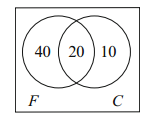
Sample Problem 1.1 There are 60 students in Dr. Brown’s Finite Mathematics course and 30 in his Calculus section. If these are his only classes, and if 20 of the students are taking both subjects, how many students does he have altogether?
Represent the data in a Venn diagram.
Solution. We use the notation F for the set of students in the finite class and C for Calculus. There are four areas in the Venn diagram: the set of students in both classes (the center area, F ∩C) has 20 members; the set of students in Finite Mathematics only (the left-hand enclosed area) has 40 members—subtract 20 from 60; the area corresponding to Calculus-only students has 30 − 20 = 10 members; and the outside area has no members (only Dr. Brown’s students are being considered). So Dr. Brown has 70 students; the diagram is
Sample Problem 1.2 120 people were surveyed to find out whether newspaper advertisements or flyers were more efficacious in advertising supermarket specials. 20 of them said they pay no attention to either medium. 50 said they read the flyers, and 15 of those said they also check the newspapers. How many use the newspaper ads, in total?
Solution. We do not know how many people read the newspaper advertisements but not the flyers. Suppose there are X of them. Then we get the Venn diagram
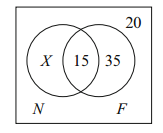
(This time we have some members in the outside area.) In order for the total to add to 120, X = 50, so the total who use the newspaper ads is X +15 = 65.
These methods can be applied to three or more sets.
Sample Problem 1.3 1,000 people were asked about their morning vitamin intake. It was found that 300 take vitamin B, 400 take vitamin C, 330 take vitamin E, 114 take both B and C, 250 take both B and E, 164 take both C and E, and 104 take all three vitamins. How many take both B and E but do not take C? How many take none of these vitamins?
Solution. We start with the diagram
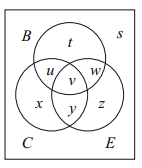
From the data, v = 104 and u+v = 114, so u = 10. Similarly, w = 146 and y = 60.
Now t +u+v+w = 300, so t = 40. The other sizes are calculated similarly, and we get the diagram

The cell corresponding to “B and E but not C” has 146 elements. There are 606elements in total, so there are 394 people who take none.
|
|
|
|
دراسة يابانية لتقليل مخاطر أمراض المواليد منخفضي الوزن
|
|
|
|
|
|
|
اكتشاف أكبر مرجان في العالم قبالة سواحل جزر سليمان
|
|
|
|
|
|
|
اتحاد كليات الطب الملكية البريطانية يشيد بالمستوى العلمي لطلبة جامعة العميد وبيئتها التعليمية
|
|
|