آخر المواضيع المضافة

 الفيزياء الكلاسيكية
الكهربائية والمغناطيسية
علم البصريات
الفيزياء الحديثة
النظرية النسبية
الفيزياء النووية
فيزياء الحالة الصلبة
الليزر
علم الفلك
المجموعة الشمسية
الطاقة البديلة
الفيزياء والعلوم الأخرى
مواضيع عامة في الفيزياء
الفيزياء الكلاسيكية
الكهربائية والمغناطيسية
علم البصريات
الفيزياء الحديثة
النظرية النسبية
الفيزياء النووية
فيزياء الحالة الصلبة
الليزر
علم الفلك
المجموعة الشمسية
الطاقة البديلة
الفيزياء والعلوم الأخرى
مواضيع عامة في الفيزياء| Amplitude of a Sine Wave |


|
|
Read More
Date: 30-12-2020
Date: 29-12-2020
Date: 26-10-2020
|
Amplitude of a Sine Wave
A graph of the function y( θ ) = c sinθ looks just like the curve in Figure (3), except the curve goes up to a height c and down to –c as shown in Figure (2). We would get the curve of Figure (2) by plotting points around a circle as in Figure (1), but using a circle of radius c. We call this factor c the amplitude of the sine wave. The function sin θ has an amplitude 1, while the sine wave in Figure (2) has an amplitude c (its values range from +c to –c).
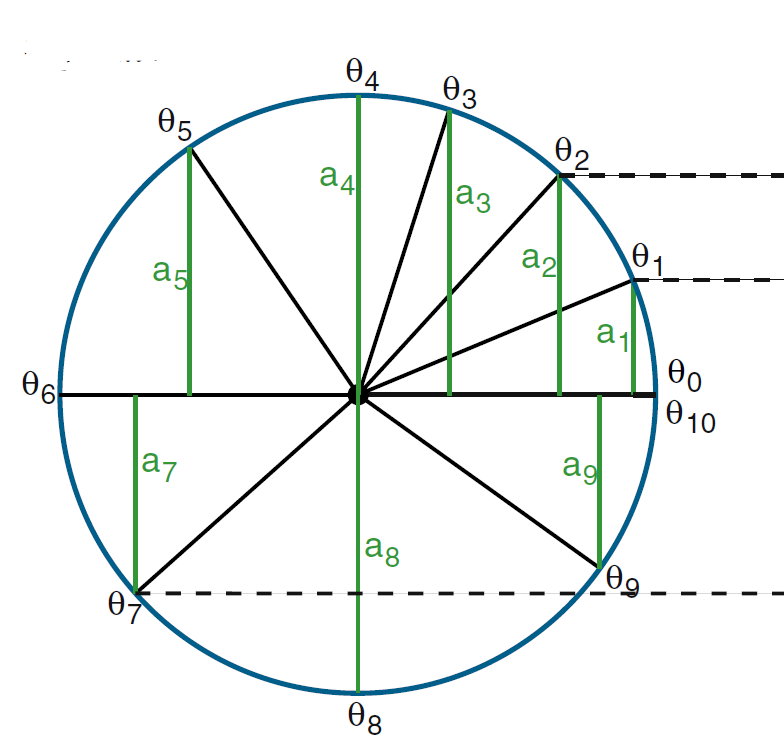
Figure 1: The heights ai at various points around a unit circle.
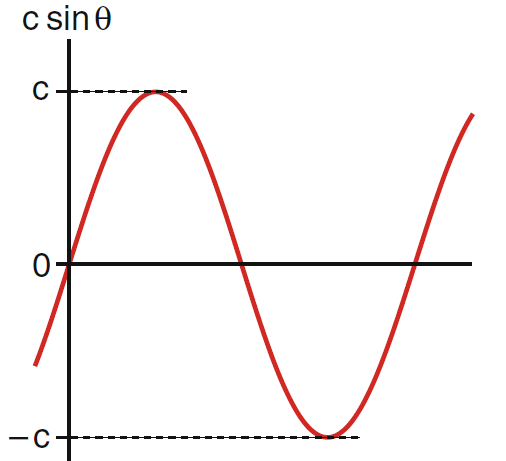
Figure 2: A sine wave of amplitude c.
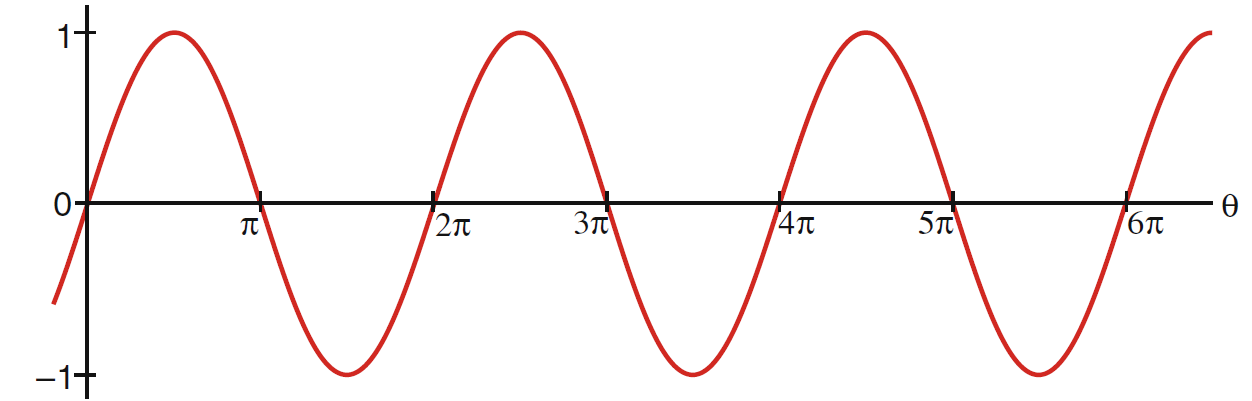
Figure 3: Several cycles of the curve sin θ .


|
|
|
|
طبيبة تبدد 5 خرافات رئيسية عن تغذية الأطفال
|
|
|
|
|
|
|
وفاة أول رجل خضع لزراعة كلية خنزير.. والمستشفى يوضح الأسباب
|
|
|
|
|
|
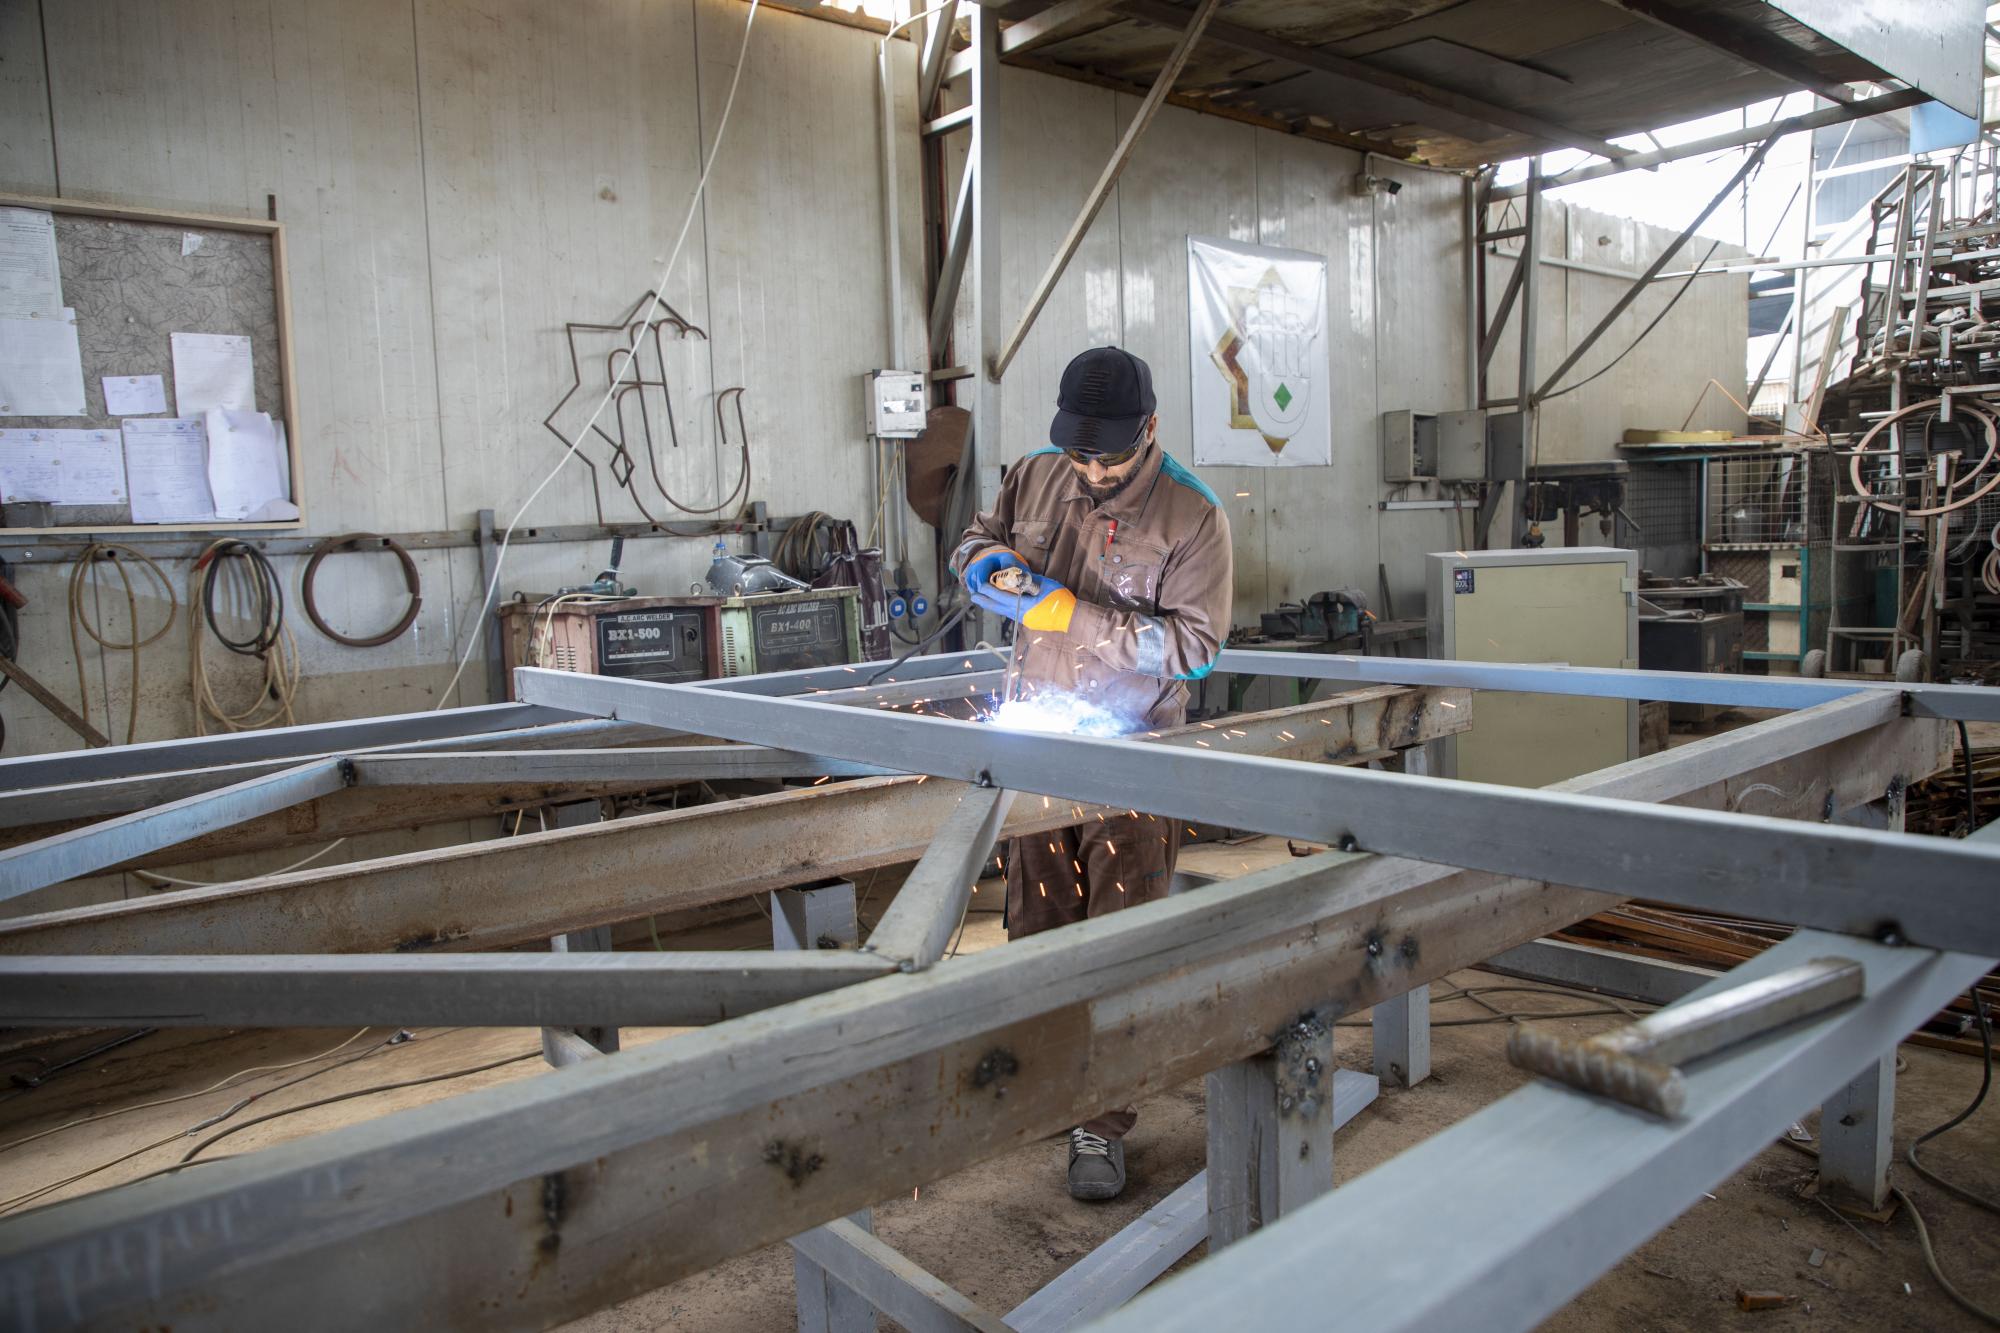
منها الشبابيك والأبواب.. أعمال فنيّة عدّة ينفذها قسم الصناعات والحرف
|
|
|
|
قسم شؤون المعارف يصدر العدد الخامس عشر من مجلة تراث البصرة
|
|
|
|
وفد العتبة العباسية يتفقد الاستعدادات الأمنيّة والخدميّة في طريق الحج البري
|
|
|
|
في الديوانية المجمع العلمي يقيم برامجه التدريبية لمدرسي دوراته القرآنية الصيفية
|