

 علم الكيمياء
 الكيمياء التحليلية
 الكيمياء الحياتية
 الكيمياء العضوية
 الكيمياء الفيزيائية
 الكيمياء اللاعضوية
 مواضيع اخرى في الكيمياء
 الكيمياء الصناعية
 |
Read More
Date: 22-2-2017
Date: 23-2-2017
Date: 23-2-2017
|
Spectral features
A characteristic feature of many d-block metal complexes is their colours, which arise because they absorb light in the visible region . Studies of electronic spectra of metal complexes provide information about structure and bonding, although interpretation of the spectra is not always straightforward. Absorptions arise from transitions between electronic energy levels:
Charge transfer (CT) gives rise to intense absorptions, whereas ‘d–d’ bands are much weaker. In some spectra, CT absorptions mask bands due to ‘d–d’ transitions, although CT absorptions (as well as ligand-centred n–π* and π–π* bands) often occur at higher energies than ‘d–d’ absorptions.
MLCT = metal-to-ligand charge transfer
LMCT = ligand-to-metal charge transfer
⊽ = 1/λ = v/c
400nm corresponds to 25 000 cm-1; 200nm corresponds to 50 000 cm-1.
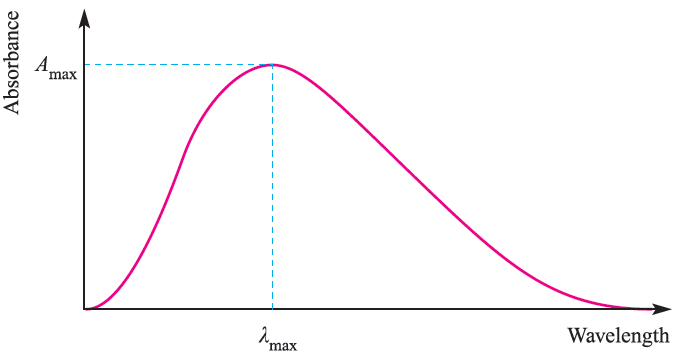
Absorption bands in electronic spectra are usually broad; the absorption of a photon of light occurs in ≈10 -18 s whereas molecular vibrations and rotations occur more slowly. Therefore, an electronic transition is a ‘snapshot’ of a molecule in a particular vibrational and rotational state, and it follows that the electronic spectrum will record a range of energies corresponding to different vibrational and rotational states. Absorption bands are described in terms of λmax corresponding to the absorption maximum Amax (Figure 1.1); the wavelength, λmax, is usually given in nm, but the position of the absorption may also be described in terms of wavenumbers,
⊽ (cm-1).


Fig.1.1 Absorptions in the electronic spectrum of a molecule or molecular ion are often broad, and cover a range of wavelengths. The absorption is characterized by values of λmax and Ԑmax
The molar extinction coefficient (or molar absorptivity) "max of an absorption must also be quoted; Ԑmax indicates how intense an absorption is and is related to Amax by equation 1.1 where c is the concentration of the solution and ℓ is the path length (in cm) of the spectrometer cell.

 (1.1)
(1.1)
Values of Ԑmax range from close to zero (a very weak absorption) to >10 000dm3 mol-1 cm-1 (an intense absorption). Some important points (for which explanations will be given later in the section) are that the electronic spectra of:


|
|
|
|
دراسة يابانية لتقليل مخاطر أمراض المواليد منخفضي الوزن
|
|
|
|
|
|
|
اكتشاف أكبر مرجان في العالم قبالة سواحل جزر سليمان
|
|
|
|
|
|
|
المجمع العلمي ينظّم ندوة حوارية حول مفهوم العولمة الرقمية في بابل
|
|
|