

 النبات
 الحيوان
 الأحياء المجهرية
 علم الأمراض
 التقانة الإحيائية
 التقنية الحيوية المكروبية
 التقنية الحياتية النانوية
 علم الأجنة
 الأحياء الجزيئي
 علم وظائف الأعضاء
 الغدد
الغدد
 المضادات الحيوية
|
Read More
Date: 25-5-2021
Date: 22-12-2015
Date: 5-5-2016
|
Hydropathy
a -helices can be identified in the primary structure of a membrane protein with a relatively high confidence using hydropathy analysis, in which each residue is assigned a characteristic hydrophobicity value. Hydropathy is a term that refers to the spectrum of amino acid side chains in the hydrophilicity–hydrophobicity scale. It was originally coined by Kyte and Doolittle(1) in an article describing an algorithm that identifies helical transmembrane spans and that came to be widely used. Their scale is based on the transfer free energies from water to vapor of model compounds for the amino acid side chains, as well as on the exterior–interior distribution of amino acids in protein structures. The hydropathy values of some residues were adjusted subjectively by the authors. Another frequently used hydrophobicity scale has been devised by Engelman, Steitz, and Goldman(2). This is a physicochemical scale based on the free energies of transfer from water to oil of amino acid residues that are parts of a helix. These free energy changes have been corrected for
unfavorable hydrophilic contributions due to polar atoms and protonation/deprotonation events of charged residues upon transfer to the nonpolar phase. A number of other scales exist. A useful review on hydrophobicity scales has been written by Eisenberg(3), and references to recent literature are provided by Wimley and White(4), who have measured the free energies of transfer of all 20 amino acid residues from the interface of a lipid bilayer to water.
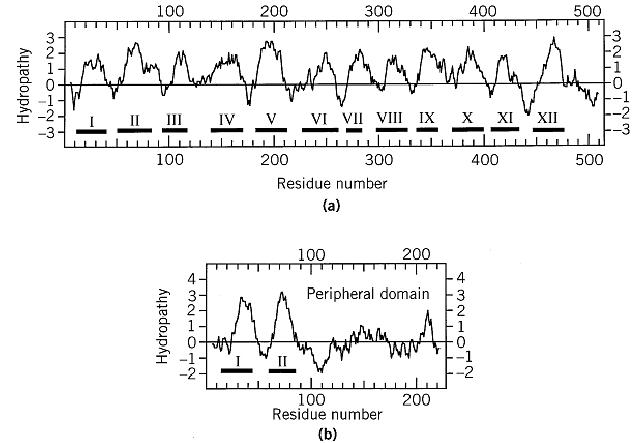
To calculate a hydropathy profile, the hydrophobicity of a chosen number of residues within a window is summed and divided by the number of residues in the window. The resulting score is assigned to the residue in the middle of the window, after which the window is moved on by one residue and the procedure is repeated. An example of a hydropathy prediction is shown in Figure 1. In the cases of bacteriorhodopsin, cytochrome oxidase, and bacterial photosynthetic reaction center, this simple analysis correctly identified the approximate positions of all the transmembrane helices, with no false positives.

Figure 1. A Kyte–Doolittle hydropathy analysis of subunits I (a) and II (b) of the bovine cytochrome c oxidase, with the true locations of the transmembrane helices marked beneath the plot. A window length of 11 residues was used. The C-terminal peripheral domain of subunit II is indicated. Helix VII of subunit I is least well predicted. It contains only 17 residues, whereas hydropathy analysis suggested a length of about 26 that partially overlaps the residues seen in the actual helix in the X-ray structure.
Several more advanced methods for prediction of transmembrane helices have been developed. In addition to the hydropathy analysis, these make use of, for example, the observation that deletions and insertions occur in homologous sequences only outside the transmembrane sequences. Thus, use of a multiple sequence alignment, instead of a single sequence, as the input for the algorithm improves the prediction. Likewise, the modern algorithms make use of statistical analyses of aminoacid preferences within transmembrane helices and in their flanking loops.
The “positive inside” rule has been incorporated into the prediction protocols to determine the orientation of the polypeptide in the membrane. This rule is based on the fact that arginine and lysine residues occur more frequently in the loops between transmembrane helices that reside in the inner side of the membrane (and are shorter than 60 residues) than in the loops on the outer surface of the membrane.
References
1. J. Kyte and R. F. Doolittle (1982) A simple method for displaying the hydropathic character of a protein. J. Mol. Biol. 157, 105–132.
2. D. M. Engelman, T. A. Steitz, and A. Goldman (1986) Identifying nonpolar transbilayer helices in amino acid sequences of membrane proteins. Annu. Rev. Biophys. Biophys. Chem. 15, 321–353.
3. D. Eisenberg (1984) Three-dimensional structure of membrane and surface proteins. Annu. Rev. Biochem. 53, 595–623.
4. W. C. Wimley and S. H. White (1996) Experimentally determined hydrophobicity scale for proteins at membrane interphases. Nature Struct. Biol. 3, 842–848.


|
|
|
|
علامات بسيطة في جسدك قد تنذر بمرض "قاتل"
|
|
|
|
|
|
|
أول صور ثلاثية الأبعاد للغدة الزعترية البشرية
|
|
|
|
|
|
|
العتبة الحسينية تطلق فعاليات المخيم القرآني الثالث في جامعة البصرة
|
|
|