آخر المواضيع المضافة

 الفيزياء الكلاسيكية
الكهربائية والمغناطيسية
علم البصريات
الفيزياء الحديثة
النظرية النسبية
الفيزياء النووية
فيزياء الحالة الصلبة
الليزر
علم الفلك
المجموعة الشمسية
الطاقة البديلة
الفيزياء والعلوم الأخرى
مواضيع عامة في الفيزياء
الفيزياء الكلاسيكية
الكهربائية والمغناطيسية
علم البصريات
الفيزياء الحديثة
النظرية النسبية
الفيزياء النووية
فيزياء الحالة الصلبة
الليزر
علم الفلك
المجموعة الشمسية
الطاقة البديلة
الفيزياء والعلوم الأخرى
مواضيع عامة في الفيزياء| SPECTROSCOPE |


|
|
Read More
Date: 7-3-2016
Date: 20-3-2016
Date: 8-3-2016
|
SPECTROSCOPE
Spectroscopes are tools allowing the analysis of emissions such as those from gas discharge tubes. These instruments work by passing incident light through a prism or, more commonly, a diffraction grating to split it into its constituent spectral components. The angle at which the resulting components are diffracted is measured, allowing determination of the exact wavelength. The angle at which the component exits the grating is determined by its wavelength according to
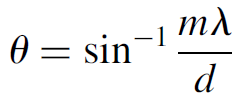
where u is the angle at which the light is diffracted, m the order of the emission (assume that m =1 here), and d the spacing between lines on the grating in meters. Consider a simple spectroscope as in Figure 1.1, used to analyze spectra emitted by a gas discharge tube. Incident light passes through a small slit and is focused by a small telescope (on the left side of the unit), falling onto the diffraction grating, which separates the components. An eyepiece on another small telescope is rotated around the grating until a particular spectral component is found. The angle at which it was diffracted may then be read from the unit and the wavelength, in nanometers,
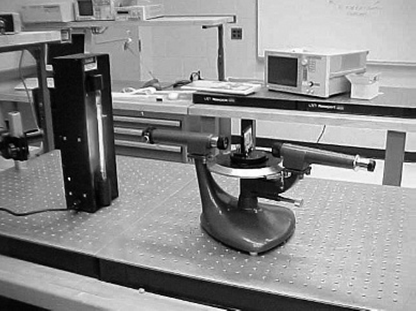
Figure 1.1. Grating spectroscope.
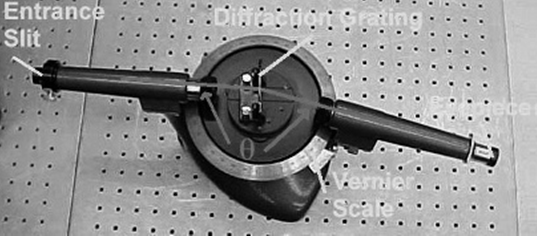
Figure 1.2. Spectroscope components.
calculated. Figure 1.2 shows a top view of the spectroscope, in which the diffraction grating and vernier scale (from where the angle is read) are seen. Increasingly complex spectroscopes employ optical arrangements using concave mirrors to increase the dispersion of light diffracted by the grating to improve the resolution of the device (the ability to separate closely spaced lines). Some instruments have optical paths over 1 m long and can discern spectral lines as close as 0.005 nm or better! As well, spectrographs may use photographic film or sensitive photomultiplier tubes to detect very weak emissions. As mentioned earlier, the spectral discharge from a gas excited by a high voltage consists of a series of discrete lines. Figure 1.3 shows the spectrum for several common gases as viewed through a direct-reading spectroscope. By analyzing these lines and their origins, atomic structure of atoms and molecules can be determined. Figure 1.3 shows the major emission lines for hydrogen, mercury, and helium, and Table 1.1 gives exact wavelengths for each line. The spectroscope used for this analysis is direct reading, in which the lines are superimposed on an illuminated wavelength scale. The accuracy of the unit is about 5 nm.
Example 1.1 Identification of an Unknown Gas Using a Grating Spectroscope
Consider a gas discharge in which three lines are visible in a spectroscope at 20.55, 23.70, and 16.45 degrees. In this particular spectroscope the angle can
TABLE 1.1. Atomic Spectra Wavelengths
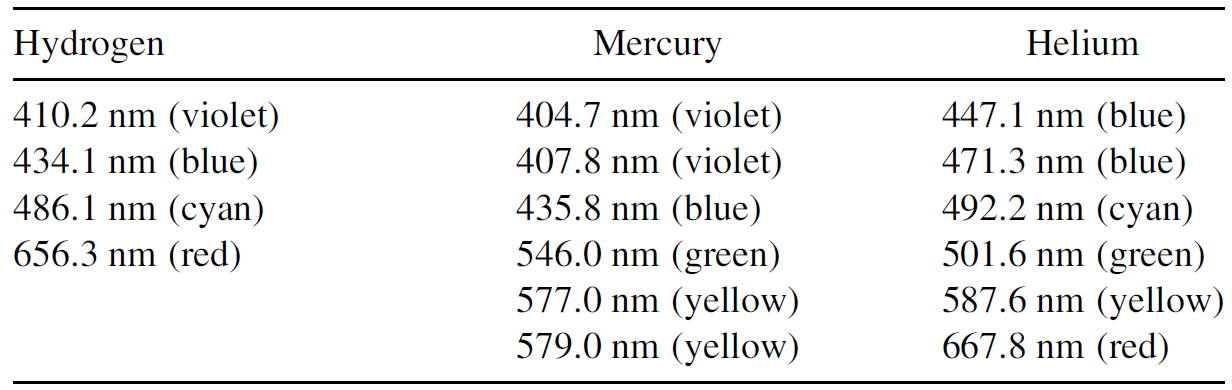
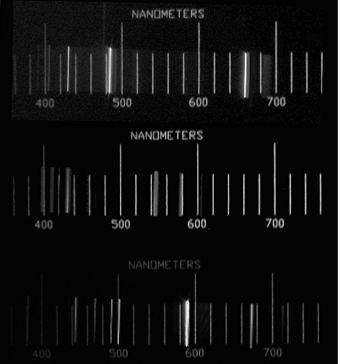
Figure 1.3. Gas emission spectra for hydrogen, mercury, and helium.
be read accurately using a vernier scale, shown in Figure 1.4. In the example illustrated in the figure, the angle is determined to be 19.8 degrees; 19 is read from the arrow and the eighth is read from the line on the vernier scale that matches that on the scale onto which the grating is mounted. Knowing that the grating is ruled at 600 lines/nm, determine the gas in the discharge tube.
SOLUTION
To begin, determine the range of wavelengths possible for each line based on the accuracy with which the angle can be determined. Examining the figure, it is evident that the angle can be read to an estimated accuracy of 0.1 degree. For the line at 20.55 degrees, the actual angle could be +0.1 degree and so could be anywhere in the range 20.45 to 20.65 degrees. Knowing that the line spacing is d =1/600,000 m21 or 1.67 × 10⁻⁶ m, we can substitute each angle into a rearranged to solve for wavelength. To determine the lower range of possible wavelengths for the unknown line:
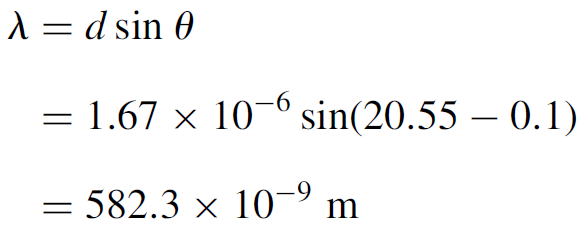

Figure 1.4. Vernier scale.
To determine the upper range of possible wavelengths for the unknown line:
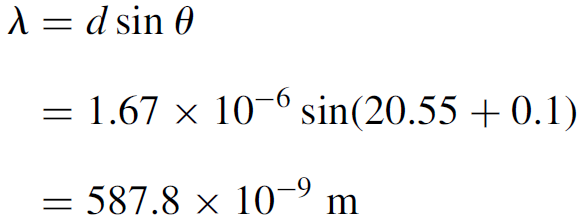
so that the possible wavelength range for this unknown line is 587.8 to 582.3 nm. Similarly, we determine the possible wavelengths of the other two lines to be 672.6 to 667.2 nm and 474.7 to 469.2 nm, respectively. Matching these lines to the known spectra of several gas discharges, we determine that the gas is helium, since a known helium line falls within the range calculated for each line seen in the spectroscope. Of all the gases listed, only helium has a line between 587.8 and 582.3 nm (at 587.6 nm), a line between 474.7 and 469.2 nm (at 471.3 nm), and a line between 672.6 and 667.2 nm (at 667.8 nm). The wavelength of each of these three helium lines falls within the possible range determined for each line. Emission lines from a gaseous discharge feature a relatively narrow spectral width, meaning that the line as viewed through a spectroscope is narrow. More formally, linewidth refers to the spread of wavelengths covered by the emission line. A spectrally narrow line spans few wavelengths, while a broad source (such as blackbody emission) spans a large range of wavelengths. Spectral width is defined numerically as the difference between the highest and lowest wavelength emitted,
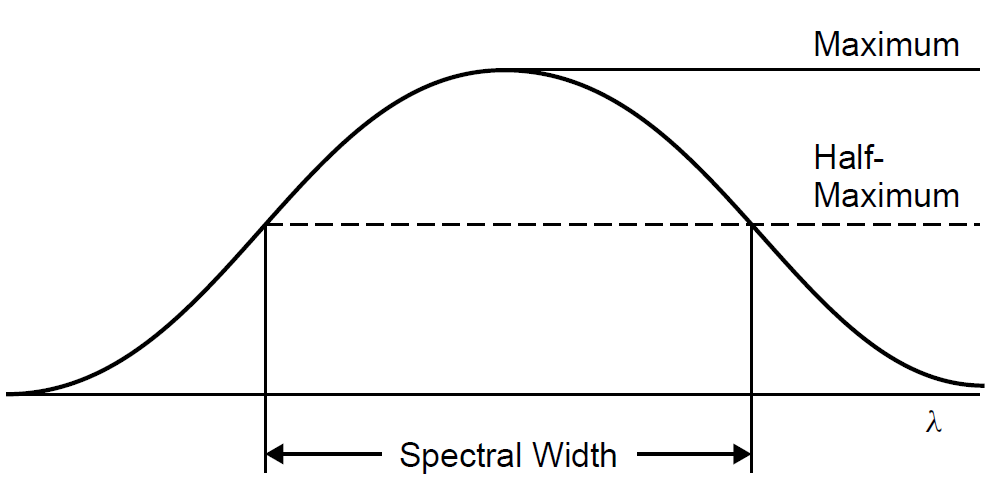
Figure 1.5. Definition of spectral width.
as located at the half-maximum intensity point of the output. This is called the full width half maximum (FWHM) of the output and is the standard way of measuring spectral width, as depicted in Figure 1.5.
|
|
|
|
دراسة: إجراء واحد لتقليل المخاطر الجينية للوفاة المبكرة
|
|
|
|
|
|
|
"الملح والماء" يمهدان الطريق لأجهزة كمبيوتر تحاكي الدماغ البشري
|
|
|
|
|
|
المجمع العلمي يكشف النشاطات الفكرية والعلمية التي أُقيمت ضمن المشروع القرآني للجامعات
|
|
|
|
الجامعات العراقية: المشروع القرآني للعتبة العباسية ترك أثرًا طيبًا في نفوس طلبة الجامعات
|
|
|
|
المجمع العلمي: المشاريع التي تتبناها العتبة العباسية تولي اهتمامًا بالغًا لطلبة الجامعات العراقية
|
|
|
|
انطلاق فعاليات الحفل الختامي للمشروع القرآني في الجامعات العراقية
|