آخر المواضيع المضافة

 تاريخ الرياضيات
الرياضيات في الحضارات المختلفة
الرياضيات المتقطعة
الجبر
الهندسة
المعادلات التفاضلية و التكاملية
التحليل
علماء الرياضيات
تاريخ الرياضيات
الرياضيات في الحضارات المختلفة
الرياضيات المتقطعة
الجبر
الهندسة
المعادلات التفاضلية و التكاملية
التحليل
علماء الرياضيات | Web Diagram |


|
|
Read More
Date: 21-12-2021
Date: 15-10-2021
Date: 19-11-2021
|
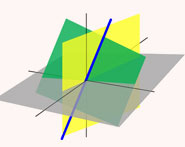
A web diagram, also called a cobweb plot, is a graph that can be used to visualize successive iterations of a function  . In particular, the segments of the diagram connect the points
  ,
,  ,
,  , .... The diagram is so-named because its straight line segments "anchored" to the functions
  and
and  can resemble a spider web. The animation above shows a web diagram for the logistic map
  with
with  .
.
REFERENCES:
Gleick, J. Chaos: Making a New Science. New York: Penguin Books, p. 176, 1988.
Gorini, C. A. The Facts on File Geometry Handbook. New York: Facts on File, p. 178, 2003.
|
|
|
|
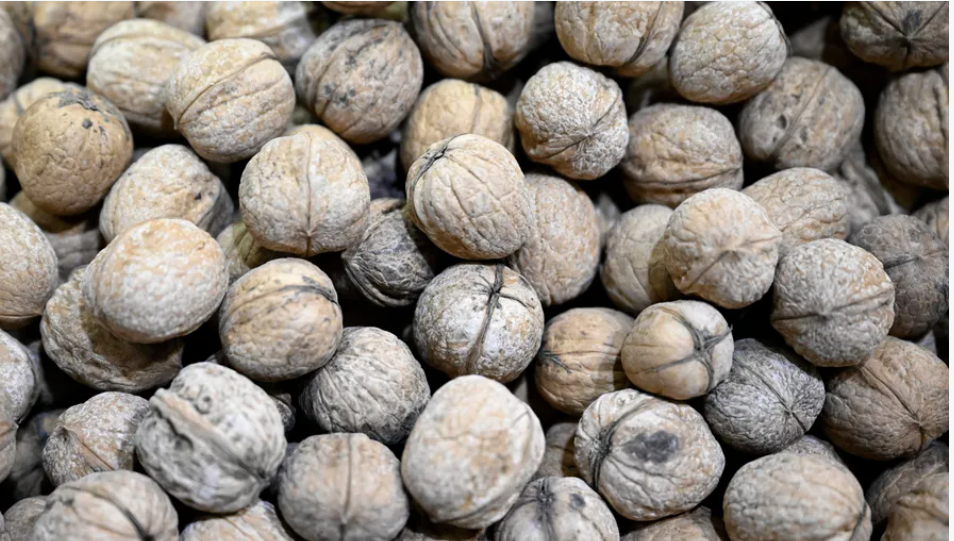
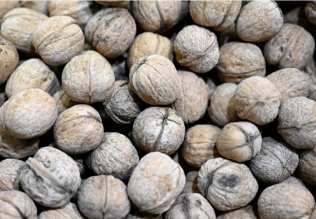
دراسة: حفنة من الجوز يوميا تحميك من سرطان القولون
|
|
|
|
|
|
|
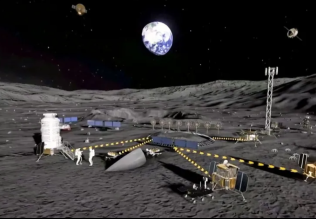
تنشيط أول مفاعل ملح منصهر يستعمل الثوريوم في العالم.. سباق "الأرنب والسلحفاة"
|
|
|
|
|
|
|
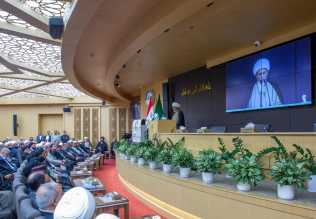
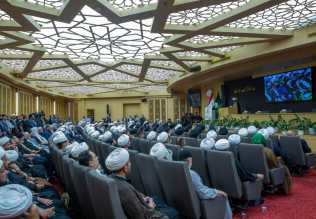
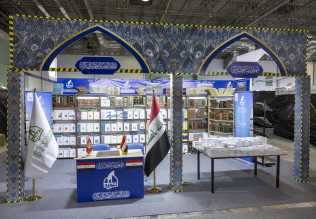
السيد الإشكوري: عدد الكتب الموصوفة في موسوعة مؤلّفات الإمامية بلغت 14 ألف كتاب
|
|
|