آخر المواضيع المضافة

 النبات
الحيوان
الأحياء المجهرية
علم الأمراض
التقانة الإحيائية
التقنية الحيوية المكروبية
التقنية الحياتية النانوية
علم الأجنة
الأحياء الجزيئي
علم وظائف الأعضاء
الغدد
المضادات الحيوية
النبات
الحيوان
الأحياء المجهرية
علم الأمراض
التقانة الإحيائية
التقنية الحيوية المكروبية
التقنية الحياتية النانوية
علم الأجنة
الأحياء الجزيئي
علم وظائف الأعضاء
الغدد
المضادات الحيوية| Lineweaver-Burk plot |


|
|
Read More
Date: 16-10-2021
Date: 3-1-2022
Date: 3-9-2021
|
Lineweaver-Burk plot
When vo is plotted against [S], it is not always possible to determine when Vmax has been achieved because of the gradual upward slope of the hyperbolic curve at high substrate concentrations. However, if 1/vo is plotted versus 1/[S], a straight line is obtained (Fig. 1). This plot, the Lineweaver-Burk plot (also called a double-reciprocal plot) can be used to calculate Km and Vmax as well as to determine the mechanism of action of enzyme inhibitors.
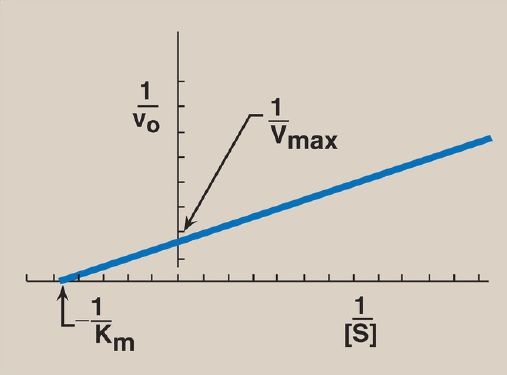
Figure 1 Lineweaver-Burk plot. vo = initial reaction velocity; Vmax = maximal velocity; Km = Michaelis constant; [S] = substrate concentration.
The equation describing the Lineweaver-Burk plot is:

where the intercept on the x axis is equal to − 1/Km, and the intercept on the y axis is equal to 1/Vmax. [Note: The slope = Km/Vmax.]


|
|
|
|
التوتر والسرطان.. علماء يحذرون من "صلة خطيرة"
|
|
|
|
|
|
|
مرآة السيارة: مدى دقة عكسها للصورة الصحيحة
|
|
|
|
|
|
|
نحو شراكة وطنية متكاملة.. الأمين العام للعتبة الحسينية يبحث مع وكيل وزارة الخارجية آفاق التعاون المؤسسي
|
|
|