

 الفيزياء الكلاسيكية
 الكهربائية والمغناطيسية
 علم البصريات
 الفيزياء الحديثة
 النظرية النسبية
 الفيزياء النووية
 فيزياء الحالة الصلبة
 الليزر
 علم الفلك
 المجموعة الشمسية
 الطاقة البديلة
 الفيزياء والعلوم الأخرى
 مواضيع عامة في الفيزياء
|
Read More
Date: 21-12-2015
Date: 23-12-2015
Date: 17-12-2015
|
Variability of Sgr A*
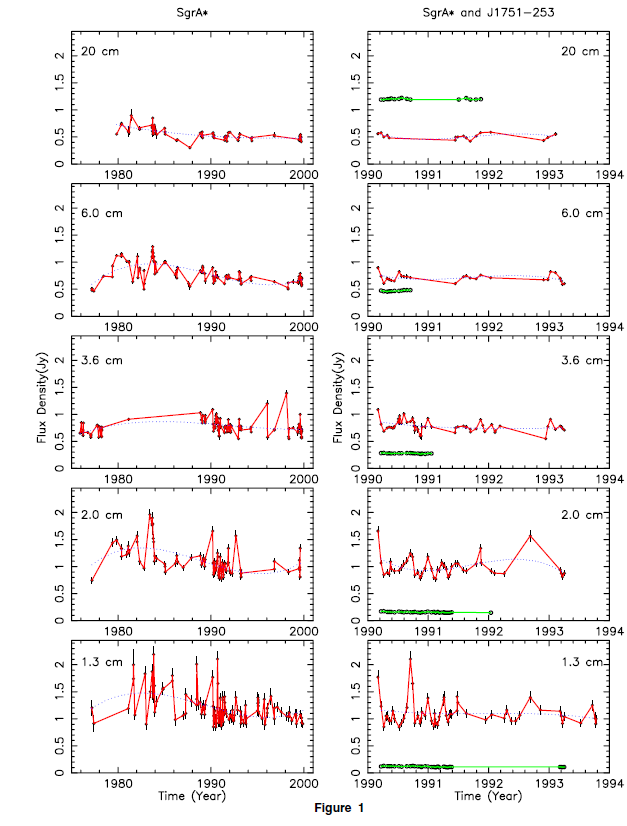
The first evidence for a a very compact structure in a radio source often comes from its variability. And indeed soon after its discovery, Sgr A* was established as a variable source (Brown and Lo 1982) and extended campaigns were set up to monitor this variability. The most extensive data sets were obtained using the Very Large Array (VLA) and the Green Bank Interferometer. The most recent data from these instruments are presented in Zhao et al (2001) and Falcke (1999). The amplitude of variability can reach up to 200% for strong flares. The degree of variability seems to increase with increasing frequency. Strong flares seem to occur on timescales of 100 days (see figure 1.1). Zhao et al (2001) even claim to have found a periodicity of 106 days on which such strong flares occur regularly. The shortest timescale of radio variability was probably found by Bower et al (2002a) at 15 GHz: 20% within 1 h.
Some of the radio variability may be due to scintillation due to a foreground screen (see p 315), but at least the large-amplitude flares at higher radio frequencies are most likely to be intrinsic. The fastest variations are fundamentally limited by the source size. We can then convert the measured timescale τ and amplitude ΔS/S of the variability into a limit on the characteristic size R of Sgr A*. For a given maximum signal speed vmax < c in the emitting plasma, one obtains
 (1.1)
(1.1)
For (ΔS/S) = 20% and τ = 1 hr we get R < 5 × 1014 cm × (vmax/c), which is 36 Astronomical Units (AU) or 4.5 milli-arcseconds (mas) at the Galactic

Figure 1.1. Variability of Sgr A* as observed with the VLA at different wavelengths (given in the top left-hand corner of each frame). From Zhao et al (2001).
Center distance of 8 kpc. Based on the variability timescale alone the radio emission therefore has to come from a region smaller than a planetary system. In fact, as we will learn in the next section, direct radio imaging shows that the emission comes from an even smaller scale.
Alternatively, taking the much longer 100 day timescale we find a characteristic size of R < 2.7 × 1017 cm × (vmax/c) or 2.3 arcseconds. This is relatively large and does not appear to be a useful limit for the size of Sgr A*. It is more likely that this variability signals some other underlying physical process, e.g. a process related to the accreting material powering the source.
If the accreting gas is in orbit around the central point mass M● the characteristic velocity will be set by Keplerian velocity v =  and the corresponding timescale is set by τ = 2π R/v, yielding
 (1.2)
(1.2)
This corresponds to about 1000 Schwarzschild radii or 8 mas. The accretion radius (chapter 10) of the hot X-ray gas in the Galactic Center is somewhat further out, but it is not impossible that instabilities in the capture process of surrounding gas by the black hole are the ultimate source of the slow, large amplitude variability. If the flares are indeed periodic as claimed by Zhao et al (2001), then one probably has to think of a star orbiting Sgr A* at this distance which modulates the accretion flow.
However, in stellar mass black holes, quasi-periodic signals are often related to beat and precession frequencies of accretion disks close to the black hole. If true, this can be used to derive information about the black hole spin. Such a scenario has been considered by Liu and Melia (2002). Based on such a model and the 100 day periodicity, they derive a black hole spin parameter of Sgr A* of a  0.1. It is difficult to assess which of these interpretations is correct.
The fastest variations are expected at the shortest wavelengths, since high frequency emission in essentially all models for Sgr A* is typically produced at the smallest scales. The problem with high-frequency measurements of Sgr A* is that these observations are extremely sensitive to weather and the low elevations of the source encountered in typical observations from the northern hemisphere. Because of the large confusing flux in the Galactic Center, interferometers have to be used. The flux density measured on an interferometer baseline can be artificially reduced by rapid changes in the atmospheric opacity and loss of coherence (of instrumental or atmospheric origin) which are difficult to track. Early observations (Wright and Backer 1993, Zylka et al 1995) already indicated possibly strong variations in the sub-millimeter wavelength region. This was later strengthened by Tsuboi et al (1999) and very recently Zhao et al (2001) claim relatively strong sub-millimeter flares in Sgr A* from measurements with the sub millimeter array (SMA) in Hawaii. These results will certainly become increasingly important in the years to come since, as we will see later, this emission most certainly comes directly from the immediate environment of the event horizon.


|
|
|
|
دراسة يابانية لتقليل مخاطر أمراض المواليد منخفضي الوزن
|
|
|
|
|
|
|
اكتشاف أكبر مرجان في العالم قبالة سواحل جزر سليمان
|
|
|
|
|
|
|
اتحاد كليات الطب الملكية البريطانية يشيد بالمستوى العلمي لطلبة جامعة العميد وبيئتها التعليمية
|
|
|