آخر المواضيع المضافة

 الفيزياء الكلاسيكية
الكهربائية والمغناطيسية
علم البصريات
الفيزياء الحديثة
النظرية النسبية
الفيزياء النووية
فيزياء الحالة الصلبة
الليزر
علم الفلك
المجموعة الشمسية
الطاقة البديلة
الفيزياء والعلوم الأخرى
مواضيع عامة في الفيزياء
الفيزياء الكلاسيكية
الكهربائية والمغناطيسية
علم البصريات
الفيزياء الحديثة
النظرية النسبية
الفيزياء النووية
فيزياء الحالة الصلبة
الليزر
علم الفلك
المجموعة الشمسية
الطاقة البديلة
الفيزياء والعلوم الأخرى
مواضيع عامة في الفيزياء| Vector diagrams of phase relationships |


|
|
Read More
Date: 16-5-2021
Date: 5-5-2021
Date: 23-4-2021
|
Vector diagrams of phase relationships
The circular renditions of sine waves, are well suited to showing phase relationships. If a sine wave X is leading a sine wave Y by some number of degrees, then the two waves can be drawn as vectors, with vector X being that number of degrees counterclockwise from vector Y. If wave X lags Y by some number of degrees, then X will be clockwise from Y by that amount.
If two waves are in phase, their vectors overlap (line up). If they are in phase opposition, they point in exactly opposite directions.
The drawings of Fig. 1 show four phase relationships between waves X and Y. At A, X is in phase with Y. At B, X leads Y by 90 degrees. At C, X and Y are 180 degrees opposite in phase; at D, X lags Y by 90 degrees. In all cases, you can think of the vectors rotating counterclockwise at the rate of f revolutions per second, if their frequency is f Hz.
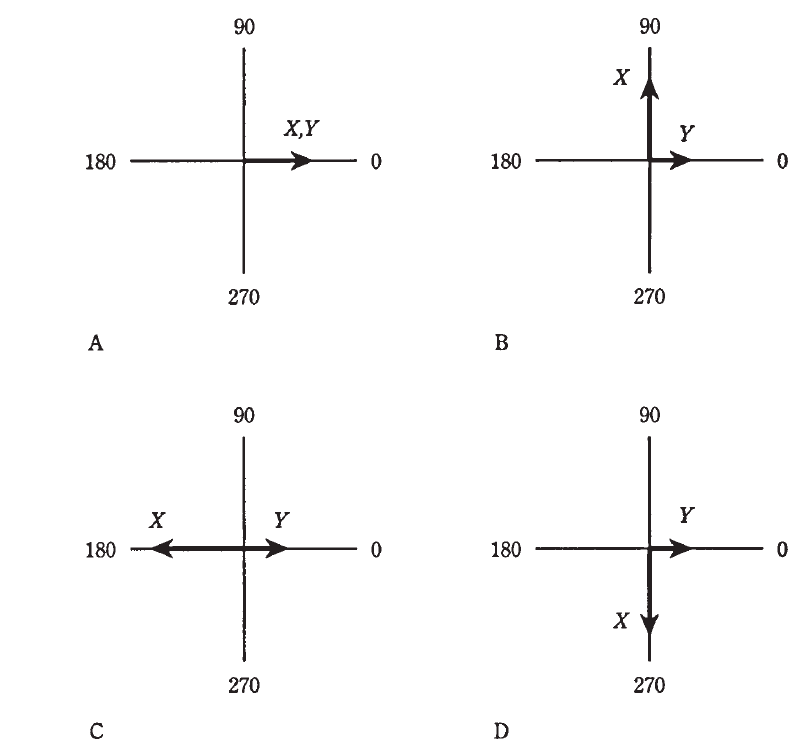
Fig. 1: Vector representation of phase. At A, waves X and Y are in phase; at B, X leads Y by 90 degrees; at C, X and Y are 180 degrees out of phase; at D, X lags Y by 90 degrees.


|
|
|
|
التوتر والسرطان.. علماء يحذرون من "صلة خطيرة"
|
|
|
|
|
|
|
مرآة السيارة: مدى دقة عكسها للصورة الصحيحة
|
|
|
|
|
|
|
نحو شراكة وطنية متكاملة.. الأمين العام للعتبة الحسينية يبحث مع وكيل وزارة الخارجية آفاق التعاون المؤسسي
|
|
|