
Grammar


Tenses


Present

Present Simple

Present Continuous

Present Perfect

Present Perfect Continuous


Past

Past Simple

Past Continuous

Past Perfect

Past Perfect Continuous


Future

Future Simple

Future Continuous

Future Perfect

Future Perfect Continuous


Parts Of Speech


Nouns

Countable and uncountable nouns

Verbal nouns

Singular and Plural nouns

Proper nouns

Nouns gender

Nouns definition

Concrete nouns

Abstract nouns

Common nouns

Collective nouns

Definition Of Nouns

Animate and Inanimate nouns

Nouns


Verbs

Stative and dynamic verbs

Finite and nonfinite verbs

To be verbs

Transitive and intransitive verbs

Auxiliary verbs

Modal verbs

Regular and irregular verbs

Action verbs

Verbs


Adverbs

Relative adverbs

Interrogative adverbs

Adverbs of time

Adverbs of place

Adverbs of reason

Adverbs of quantity

Adverbs of manner

Adverbs of frequency

Adverbs of affirmation

Adverbs


Adjectives

Quantitative adjective

Proper adjective

Possessive adjective

Numeral adjective

Interrogative adjective

Distributive adjective

Descriptive adjective

Demonstrative adjective


Pronouns

Subject pronoun

Relative pronoun

Reflexive pronoun

Reciprocal pronoun

Possessive pronoun

Personal pronoun

Interrogative pronoun

Indefinite pronoun

Emphatic pronoun

Distributive pronoun

Demonstrative pronoun

Pronouns


Pre Position


Preposition by function

Time preposition

Reason preposition

Possession preposition

Place preposition

Phrases preposition

Origin preposition

Measure preposition

Direction preposition

Contrast preposition

Agent preposition


Preposition by construction

Simple preposition

Phrase preposition

Double preposition

Compound preposition

prepositions


Conjunctions

Subordinating conjunction

Correlative conjunction

Coordinating conjunction

Conjunctive adverbs

conjunctions


Interjections

Express calling interjection

Phrases

Sentences

Clauses

Part of Speech


Grammar Rules

Passive and Active

Preference

Requests and offers

wishes

Be used to

Some and any

Could have done

Describing people

Giving advices

Possession

Comparative and superlative

Giving Reason

Making Suggestions

Apologizing

Forming questions

Since and for

Directions

Obligation

Adverbials

invitation

Articles

Imaginary condition

Zero conditional

First conditional

Second conditional

Third conditional

Reported speech

Demonstratives

Determiners

Direct and Indirect speech


Linguistics

Phonetics

Phonology

Linguistics fields

Syntax

Morphology

Semantics

pragmatics

History

Writing

Grammar

Phonetics and Phonology

Semiotics


Reading Comprehension

Elementary

Intermediate

Advanced


Teaching Methods

Teaching Strategies

Assessment
Waveforms
المؤلف:
Richard Ogden
المصدر:
An Introduction to English Phonetics
الجزء والصفحة:
30-3
11-6-2022
1179
Waveforms
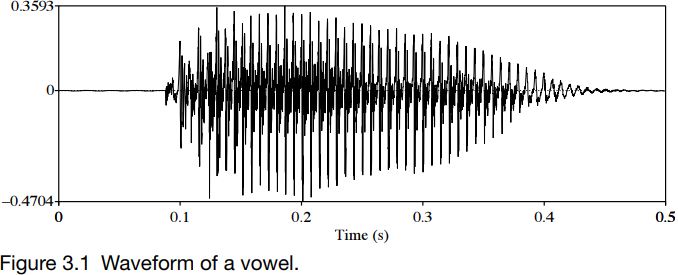
Waveforms are a kind of graph. Graphs have an x-axis, which runs horizontally, and a y-axis, which runs vertically. In waveforms of speech, the x-axis represents time and is usually scaled in seconds or milliseconds, while the y-axis shows (to simplify a great deal) amplitude, a representation of loudness.

Figure 3.1 shows a waveform of a vowel. On the x-axis, time is marked at 0.1 second (or 100 ms) intervals. On the y-axis, there is a line marked 0 (the zero crossing) which goes through the waveform. The bigger the displacement from this line, the louder the sound is. The beginning and end of this waveform have no displacement from the zero crossing line, so the recording begins and ends with a period of silence. The sound starts just before 0.1 s into the recording, and is loudest around 0.2 s. From a little after 0.2 s to around 0.45 s, the sound gets quieter: or, a little more technically, the amplitude decreases. By about 0.45 s, the signal has died away.
With a little experience and practice, various other kinds of sound are also evident in waveforms. We will look at these after we have considered spectrograms.
 الاكثر قراءة في Phonetics
 اخر الاخبار
اخبار العتبة العباسية المقدسة

الآخبار الصحية


 قسم الشؤون الفكرية يصدر كتاباً يوثق تاريخ السدانة في العتبة العباسية المقدسة
 "المهمة".. إصدار قصصي يوثّق القصص الفائزة في مسابقة فتوى الدفاع المقدسة للقصة القصيرة
 (نوافذ).. إصدار أدبي يوثق القصص الفائزة في مسابقة الإمام العسكري (عليه السلام)


