

 علم الكيمياء
 الكيمياء التحليلية
 الكيمياء الحياتية
 الكيمياء العضوية
 الكيمياء الفيزيائية
 الكيمياء اللاعضوية
 مواضيع اخرى في الكيمياء
 الكيمياء الصناعية
 |
أقرأ أيضاً
التاريخ: 28-7-2018
التاريخ: 22-10-2019
التاريخ: 27-12-2016
التاريخ: 2025-04-15
|
What information can we derive about molecular structure from the vibrational bands of infrared spectra? Absorption of radiation in the range of 5000-1250cm−1 is characteristic of the types of bonds present in the molecule, and corresponds for the most part to stretching vibrations. For example, we know that the C−H bonds of alkanes and alkyl groups have characteristic absorption bands around 2900cm−1; an unidentified compound that shows absorption in this region will very likely have alkane-type C−H bonds.
More explicitly, the band observed for 2-propanone (Figure 9-9a) at 3050cm−1 arises from absorption of infrared radiation, which causes transitions between the ground vibrational state (or lowest vibrational energy level) of a C−H bond and the first excited vibrational energy level for stretching of that C−H bond. The band at 1740cm−1 corresponds to the infrared absorption that causes transitions between vibrational energy levels of the C=O bond. The reason that these are transitions from the vibrational ground state is because, at room temperature, by far the largest portion of the molecules are in this state.
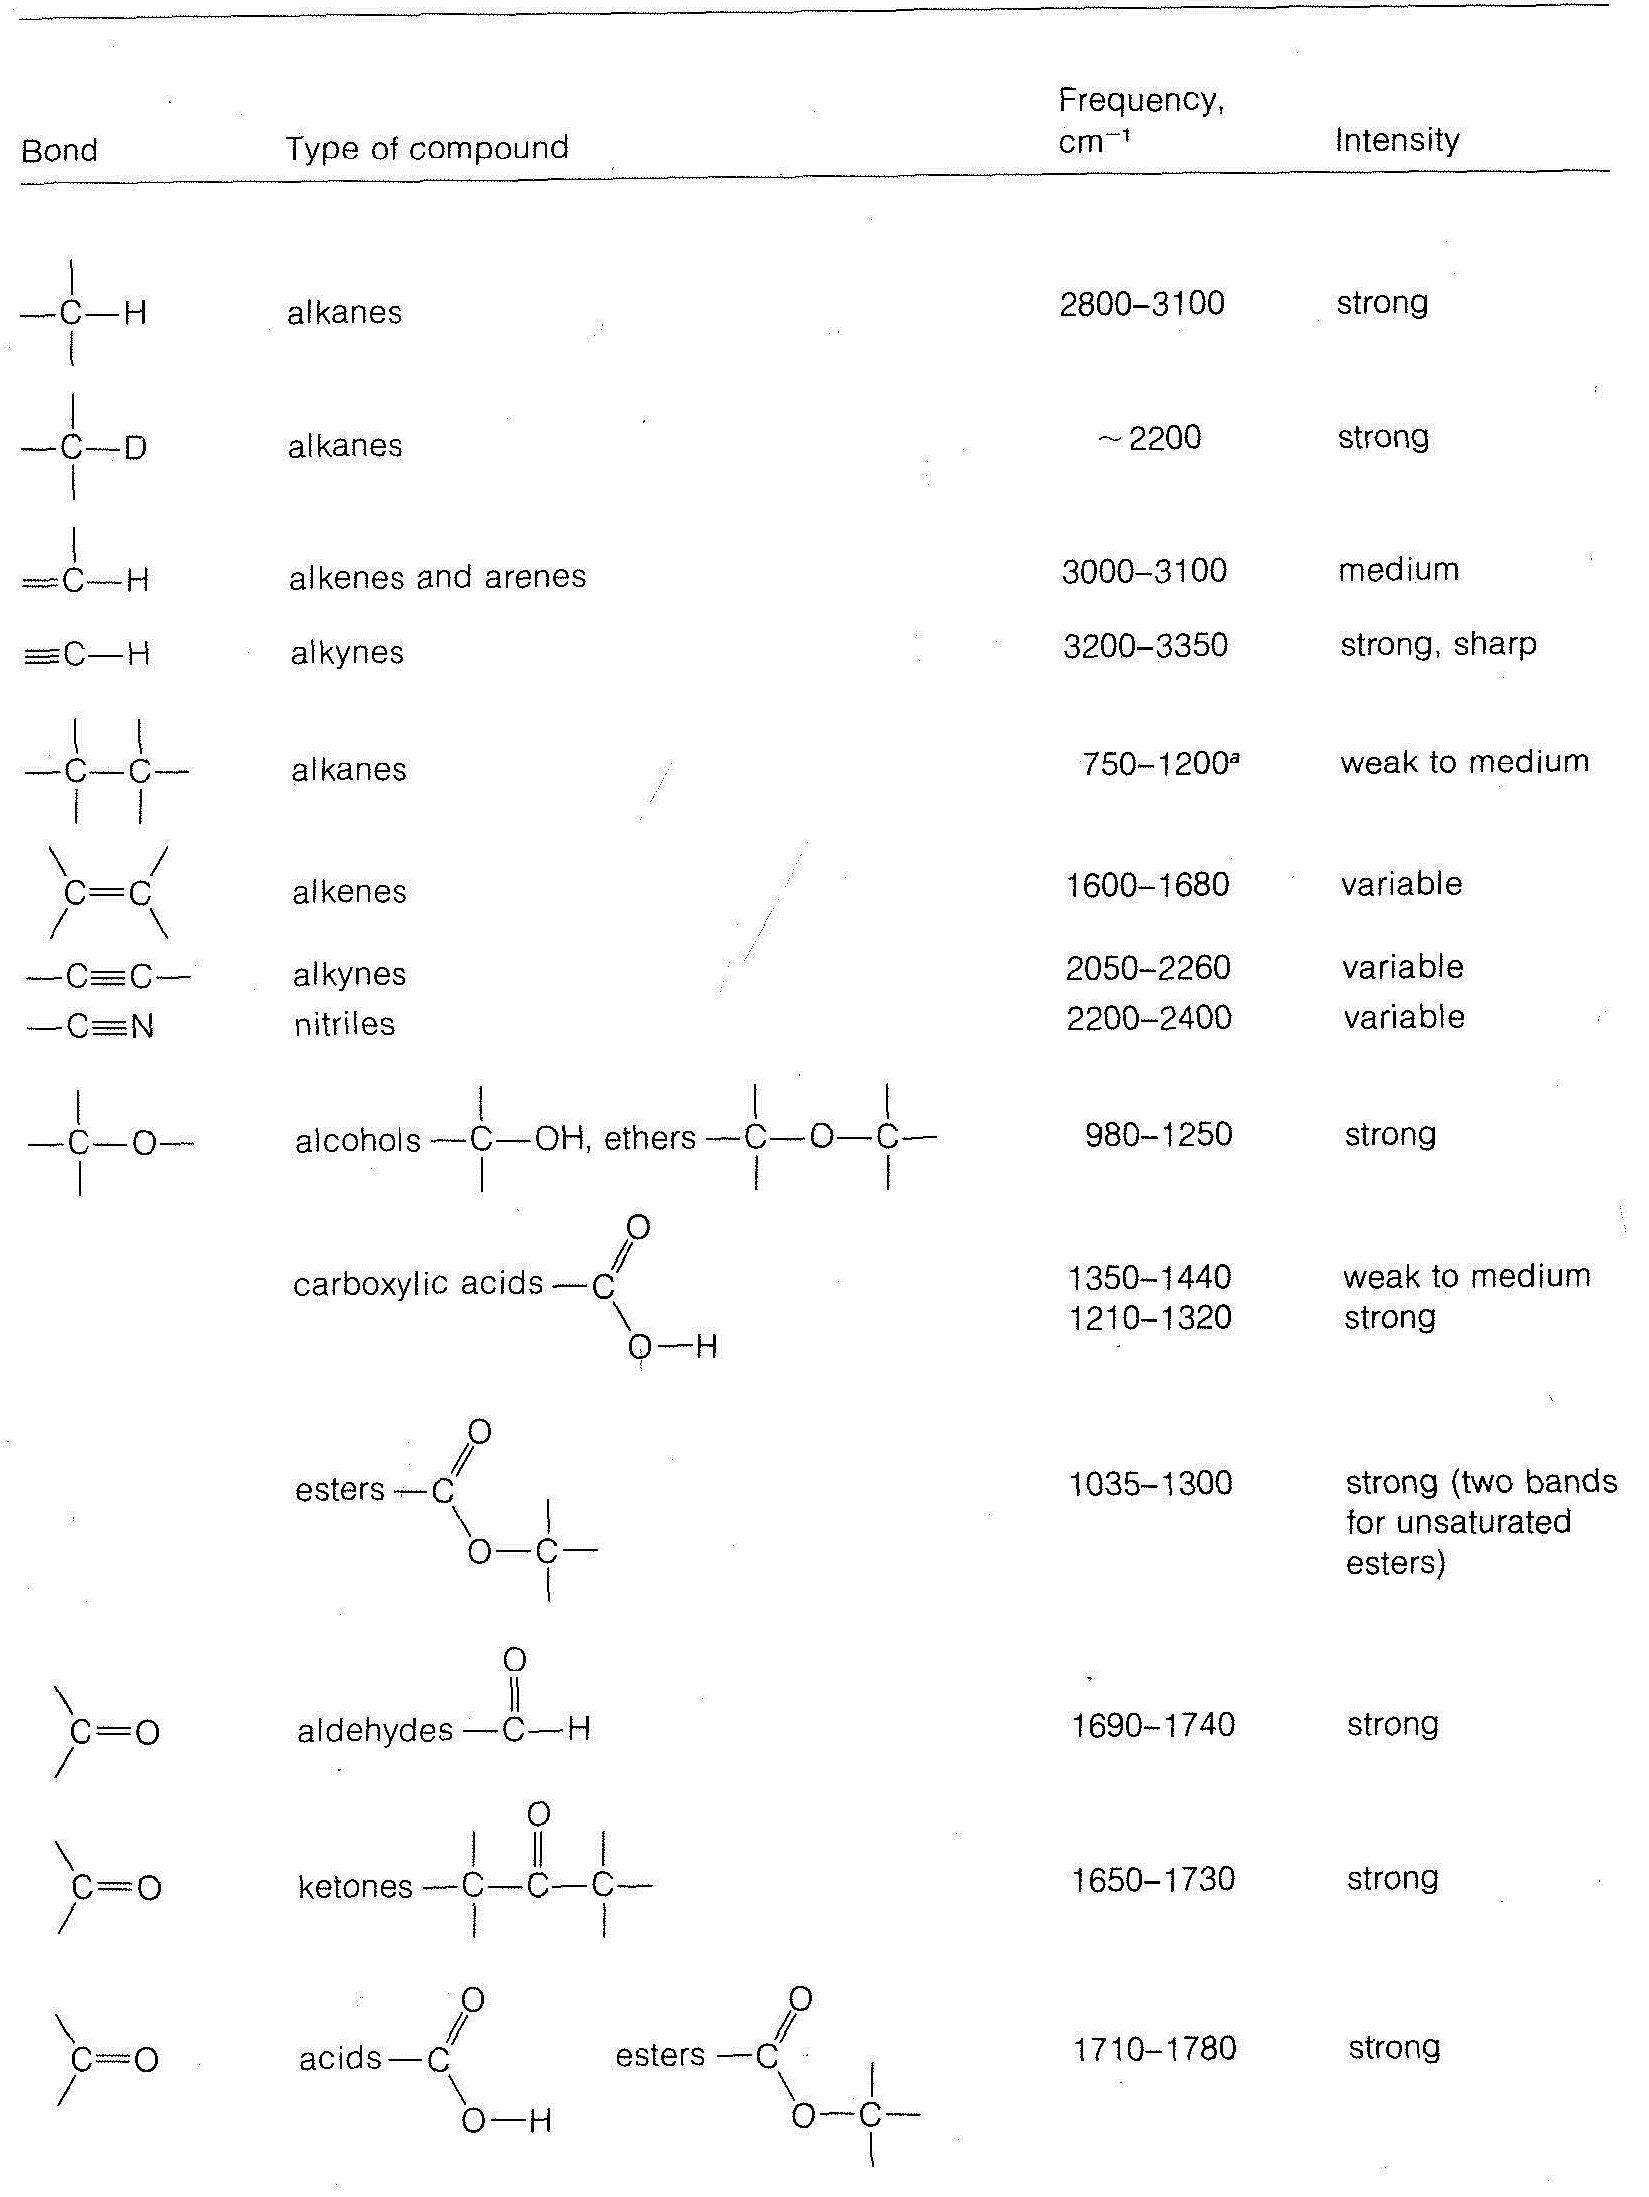
Stretching frequencies characteristic of the most important types of bonds found in organic molecules are given in Table 9-2. You will notice that the absorption band for each bond type is described by its position within a more or less broad frequency range and by its shape (broad, sharp) and intensity (strong, medium, weak).
A qualitative discussion of the factors that determine infrared band position and band intensities follows. To a first approximation, a chemical bond resembles a mechanical spring that vibrates with a stretching frequency ν¯ (cm−1),
in which k is the force constant, and m1 and m2 are the masses of the individual atoms at each end of the bond. The force constant kk is a measure of the stiffness of the bond and usually is related to the bond strength. From Equation 9-3, we can see that the heavier the bonded atoms, the smaller will be the vibrational frequency of the bond provided kk remains essentially constant.66 Thus if we increase m2 while holding kk and m1m1 constant we expect the frequency to decrease. This is just what occurs when we change the C−H bond to a C−D bond. We also see that the frequency decreases in the order C−H > C−C > C−N > C−O, which also is in the order of increasing m2, but here matters are more complicated because k also changes.
Other things being equal, it requires more energy to stretch a bond than to bend it. Therefore the infrared bands arising from changes in the stretching vibrations are found at higher frequencies than are those arising from changes in the bending vibrations.
Another consequence of Equation 9-3 is that if m1 and m2 remain the same, the larger the value of kk, the higher will be the vibrational frequency. Because kk is expected to run more or less parallel to the bond strength, and because multiple bonds are stronger than single bonds, the absorption frequencies of multiple bonds are higher than for single bonds. Examples are the absorption of C=C at 2100cm−1, C=C at 1650cm−1, and C−C at 1000cm−1.
Other effects besides mass and bond strength also affect infrared absorption frequencies. The structural environment of a bond is particularly important. Thus the absorption frequency of a C−H bond depends on whether it is an alkyl, alkenyl, alkynyl, or aryl C−H bond (see Table 9-2).
The intensity of an infrared absorption band arising from changes in the vibrational energy is related to the electrical symmetry of the bond. More symmetrical, less polarized bonds give weaker absorptions. In fact, if the bond is completely symmetrical, there is no infrared absorption. In contrast, unsymmetrical molecules in which the bonds are quite polarized, such as C=O bonds, show strong infrared absorptions.
Notice in Figure 9-9 that infrared spectra of organic molecules do not show very sharp absorption lines. This is because changes in rotational energies can occur together with the vibrational changes. The reason can be seen more clearly in Figure 9-10, in which each vibrational level, such as E1 and E2, of a molecule has associated with it closely spaced rotational levels. Transitions between E1E1 and E2 also may involve changes in rotational levels. This gives a “band” of closely spaced lines for any given vibrational change. For complex molecules, particularly in the liquid state, the “rotational fine structure” of a given vibrational band usually cannot be resolved.
Figure 9-10: Schematic vibrational and rotational energy levels. The arrows correspond to infrared vibrational-rotational transitions of different energies.
Table 9-2: Some Characteristic Infrared Absorption Frequencies

Figure 9-10, of 1.7kcal mol−1 to 10.3kcal mol−1.


|
|
|
|
للعاملين في الليل.. حيلة صحية تجنبكم خطر هذا النوع من العمل
|
|
|
|
|
|
|
"ناسا" تحتفي برائد الفضاء السوفياتي يوري غاغارين
|
|
|
|
|
|
|
نحو شراكة وطنية متكاملة.. الأمين العام للعتبة الحسينية يبحث مع وكيل وزارة الخارجية آفاق التعاون المؤسسي
|
|
|