آخر المواضيع المضافة

 علم الكيمياء
الكيمياء التحليلية
الكيمياء الحياتية
الكيمياء العضوية
الكيمياء الفيزيائية
الكيمياء اللاعضوية
مواضيع اخرى في الكيمياء
الكيمياء الصناعية
علم الكيمياء
الكيمياء التحليلية
الكيمياء الحياتية
الكيمياء العضوية
الكيمياء الفيزيائية
الكيمياء اللاعضوية
مواضيع اخرى في الكيمياء
الكيمياء الصناعية | Phase diagrams |


|
|
Read More
Date: 13-6-2019
Date: 16-7-2017
Date: 1-11-2020
|
A phase diagram is a graphical representation of the equilibrium relationships that exist between the phases of a substance under specified pressures and temperatures (Figure 1.1). The phase diagram is a combination of three curves: the vapour pressure curve, the melting curve and the sublimation curve. We have previously seen that vapour pressure curves represent the equilibrium between the liquid and gas phase, and the point at which the pressure equals 1 atm is the normal boiling point. One additional feature of this curve in the phase diagram (green), is that it ends at the critical point. The critical point is the point at the highest temperature and pressure at which liquids and gases remain distinguishable. At temperatures and pressure beyond this point the matter exists in a phase with properties of both liquids and gases known as a supercritical fluid.
The melting curve (orange) represents the equilibrium between solid and liquid, and the point at which the pressure equals 1 atm is the normal melting point. The sublimation curve (blue) represents the equilibrium which exists between solid and gas. Finally, the point where all three curves meet is known as the triple point. At this point, three phases (solid, liquid and gas) all exist at equilibrium.

Figure 1.1. A generic phase diagram.
Example:Using the following phase diagram, determine what would happen if:

a. The temperature is increased for matter at point 1.
b. The pressure is increased for matter at point 3.
Solution:a. Matter at point 1 will melt (change phase from solid to liquid) if the temperature is increased.
b. Matter at point 3 will condense (change phase from gas to liquid) if the temperature is increased.
|
|
|
|
الصين.. طريقة لمنع تطور قصر النظر لدى تلاميذ المدارس
|
|
|
|
|
|
|
ماذا سيحدث خلال كسوف الشمس يوم السبت؟
|
|
|
|
|
|
|
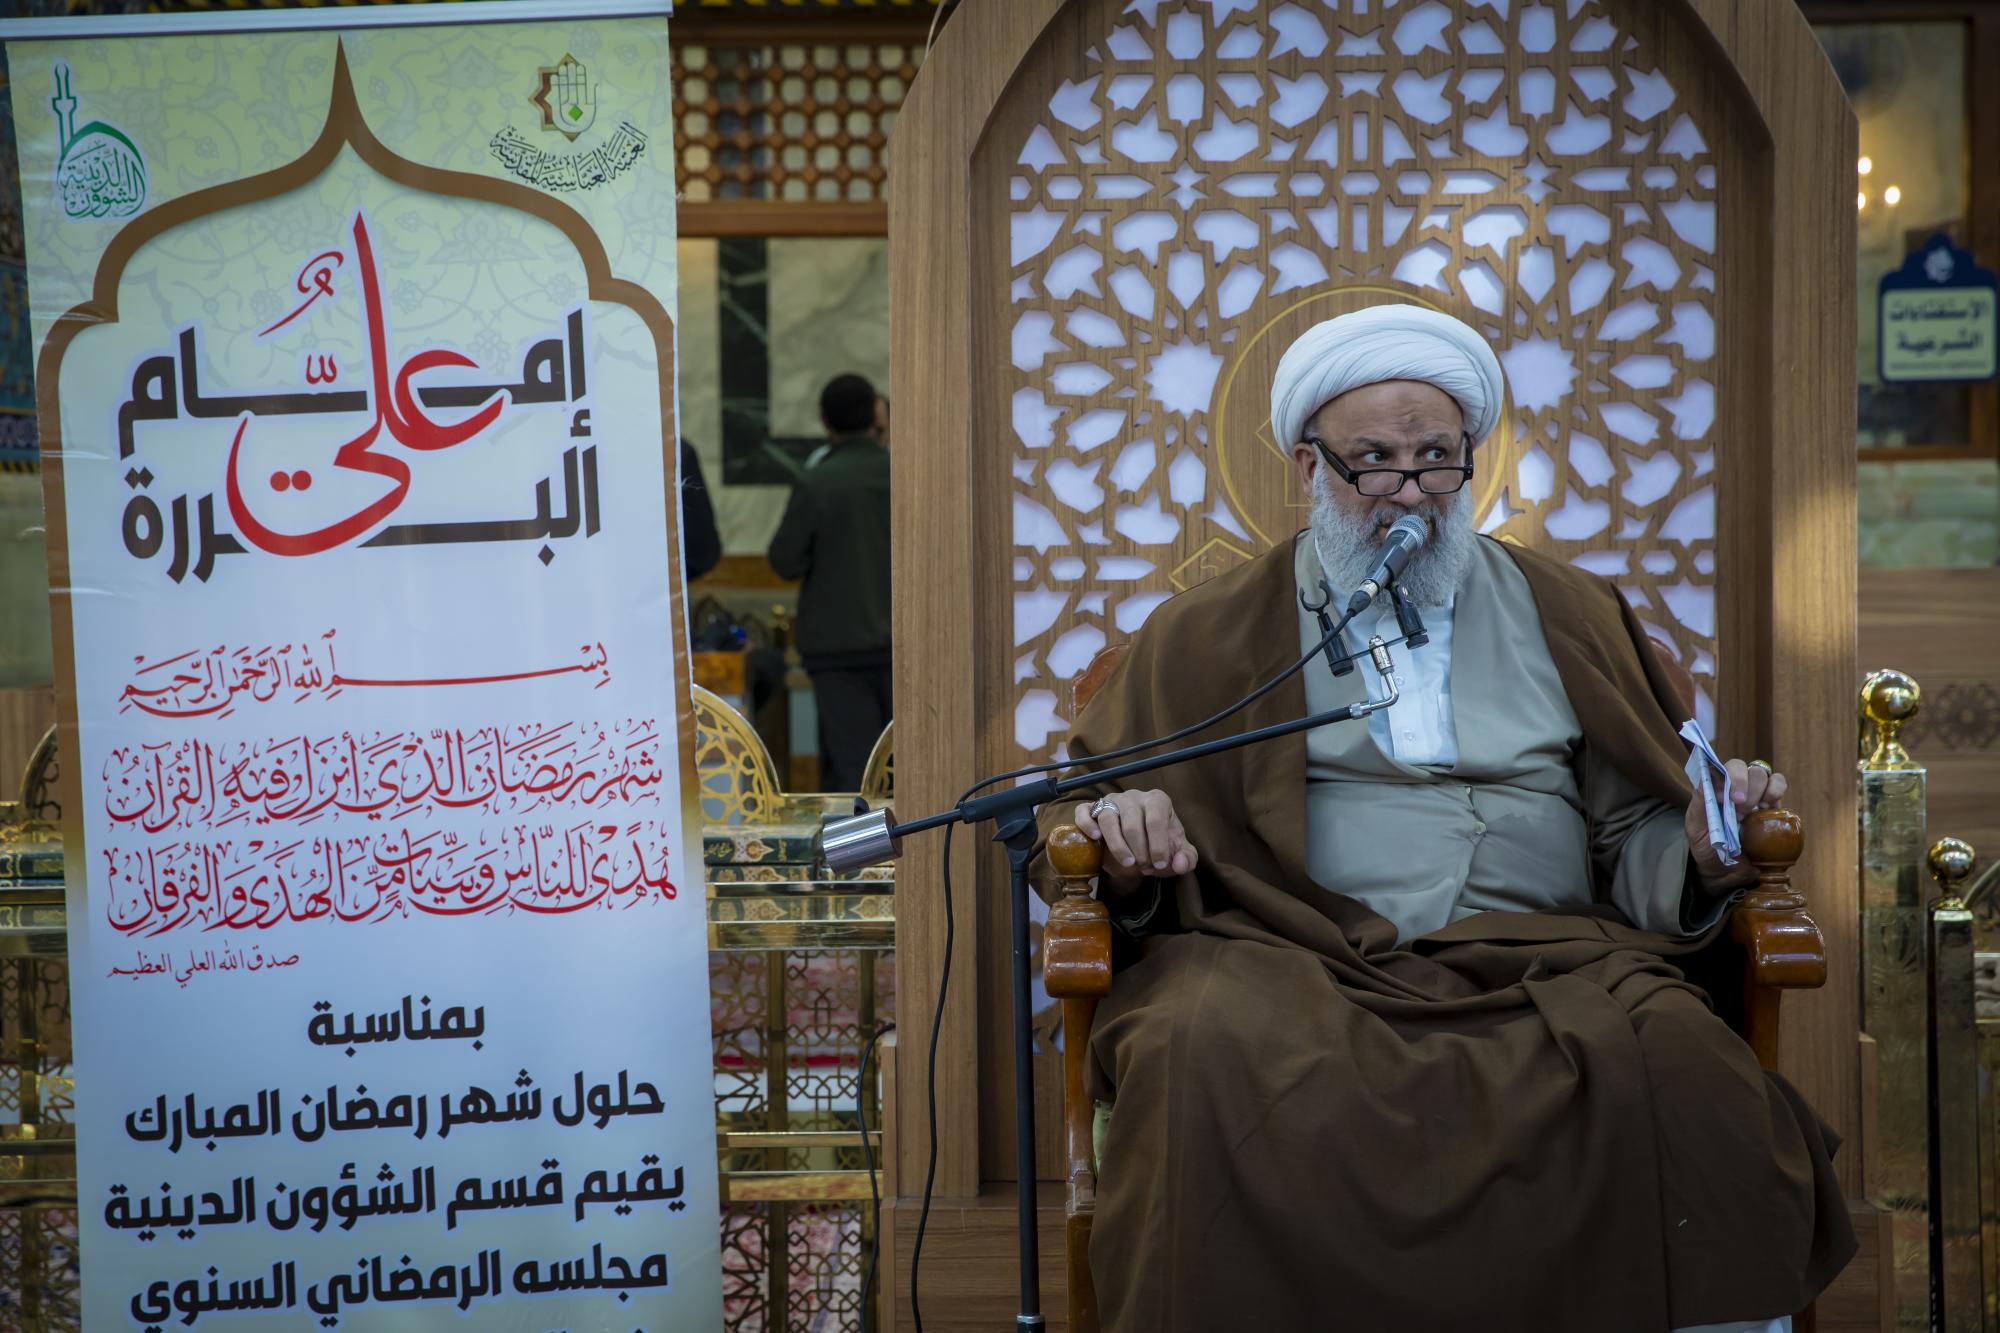
قسم الشؤون الدينية يختتم محاضراته الرمضانية في صحن مرقد أبي الفضل العباس (عليه السلام)
|
|
|