تاريخ الفيزياء
علماء الفيزياء


الفيزياء الكلاسيكية
الميكانيك
الديناميكا الحرارية
الكهربائية والمغناطيسية
الكهربائية
المغناطيسية
الكهرومغناطيسية
علم البصريات
تاريخ علم البصريات
الضوء
مواضيع عامة في علم البصريات
الصوت
الفيزياء الحديثة
النظرية النسبية
النظرية النسبية الخاصة
النظرية النسبية العامة
مواضيع عامة في النظرية النسبية
ميكانيكا الكم
الفيزياء الذرية
الفيزياء الجزيئية
الفيزياء النووية
مواضيع عامة في الفيزياء النووية
النشاط الاشعاعي
فيزياء الحالة الصلبة
الموصلات
أشباه الموصلات
العوازل
مواضيع عامة في الفيزياء الصلبة
فيزياء الجوامد
الليزر
أنواع الليزر
بعض تطبيقات الليزر
مواضيع عامة في الليزر
علم الفلك
تاريخ وعلماء علم الفلك
الثقوب السوداء
المجموعة الشمسية
الشمس
كوكب عطارد
كوكب الزهرة
كوكب الأرض
كوكب المريخ
كوكب المشتري
كوكب زحل
كوكب أورانوس
كوكب نبتون
كوكب بلوتو
القمر
كواكب ومواضيع اخرى
مواضيع عامة في علم الفلك
النجوم
البلازما
الألكترونيات
خواص المادة
الطاقة البديلة
الطاقة الشمسية
مواضيع عامة في الطاقة البديلة
المد والجزر
فيزياء الجسيمات
الفيزياء والعلوم الأخرى
الفيزياء الكيميائية
الفيزياء الرياضية
الفيزياء الحيوية
الفيزياء والفلسفة
الفيزياء العامة
مواضيع عامة في الفيزياء
تجارب فيزيائية
مصطلحات وتعاريف فيزيائية
وحدات القياس الفيزيائية
طرائف الفيزياء
مواضيع اخرى

Direction of arrival of the radiation
 المؤلف:
A. Roy, D. Clarke
المؤلف:
A. Roy, D. Clarke
 المصدر:
Astronomy - Principles and Practice 4th ed
المصدر:
Astronomy - Principles and Practice 4th ed
 الجزء والصفحة:
p 24
الجزء والصفحة:
p 24
 14-7-2020
 3143
3143


+
-
20
Direction of arrival of the radiation
Measurements of the direction of arrival of radiation are equivalent to determining the positions of objects on the celestial sphere. In the case of the optical region of the spectrum, the apparent size of each star is smaller than the instrumental profile of even the best recording instrument. To all intents and purposes, stars may, therefore, be treated as point sources and their positions may be marked as points on the celestial sphere. For extended objects such as nebulae and for radiation in the radio region, the energy from small parts of the source can be recorded with a spatial resolution limited only by the instrumental profile of the measuring instrument. Again the strength of the radiation can be plotted on the celestial sphere for the positions where a recording has been made.
In order to plot the positions on the celestial sphere of the sources of radiation, it is obvious that some coordinate system with reference points is needed. For the system to be of real use, it must be independent of the observer’s position on the Earth. The coordinate system used has axes known as right ascension (RA or α) and declination (Dec or δ). RA and Dec can be compared to the coordinate system of longitude and latitude for expressing a particular position on the Earth’s surface.
The central part of figure 5.1 depicts the Earth and illustrates the reference circles of the equator and the Greenwich meridian. The position of a point on the Earth’s surface has been marked together with the longitude (λ W) and latitude (φ N), angles which pinpoint this position. The outer sphere on figure 5.1 represents the celestial sphere on which the energy source positions are recorded. The reference circle of the celestial equator corresponds to the projection of the Earth’s equator on to the celestial sphere and the declination (δ*) of a star’s position is analogous to the latitude angle of a point on the Earth’s surface. As the Earth is rotating under the celestial sphere, the projection of the Greenwich meridian would sweep round the sphere, passing through all the stars’ positions in
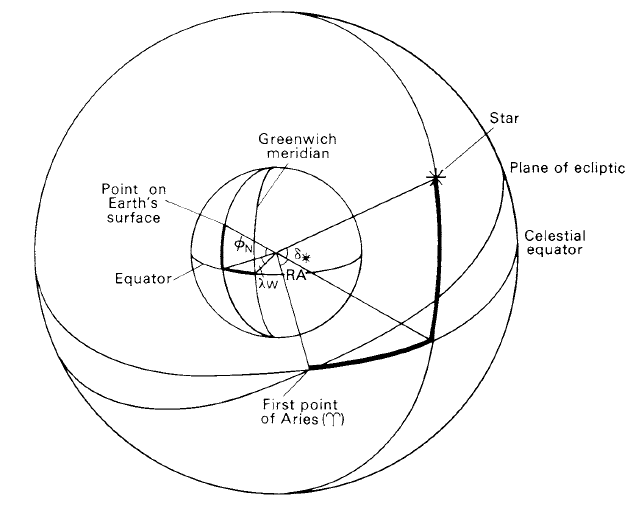
Figure 1. Coordinate systems for the Earth (longitude and latitude) and for the celestial sphere (right ascension and declination).
turn. In order to label the stars’ positions, therefore, some other meridian must be chosen which is connected directly to the celestial sphere.
During the course of the year, the Sun progresses eastwards round the celestial sphere along an apparent path known as the ecliptic. Because the Earth’s axis of rotation is set at an angle to the perpendicular to its orbital plane around the Sun, the ecliptic circle is set at the same angle to the celestial equator. The points of intersection of the circles may be used as reference points on the celestial equator; however, it is the intersection where the Sun crosses the equator from south to north which is chosen as the reference point. This position which is fixed with respect to the stellar background is known as the first point of Aries,  or the vernal equinox (see figure 1). The meridian through this point corresponds to RA = 0 hr.
Any stars which happen to be on the observer’s meridian (north–south line projected on the celestial sphere) are related in position to the reference meridian on the celestial sphere by time. Consequently, a star’s position in RA is normally expressed in terms of hours, minutes and seconds of time rather than in degrees, minutes and seconds of arc. By convention, values of RA increase in an easterly direction round the celestial sphere. As a result, the sky acts as a clock in that the passage of stars across the meridian occurs at later times according to their RA values. A star’s position in declination is expressed in degrees, minutes and seconds of arc and is positive or negative depending on whether it is in the northern or southern celestial hemisphere.
For an observer at the bottom of the Earth’s atmosphere, the problem of recording the energy source positions in terms of RA and Dec is made difficult by the very existence of the atmosphere. The direction of propagation of any radiation is affected, in general, when it meets a medium where there is a change in the refractive index. In particular, for astronomical observations made in the optical region of the spectrum, the change of direction increases progressively as the radiation penetrates deeper into the denser layers of the atmosphere. The curvature of a beam of light from a star is depicted in
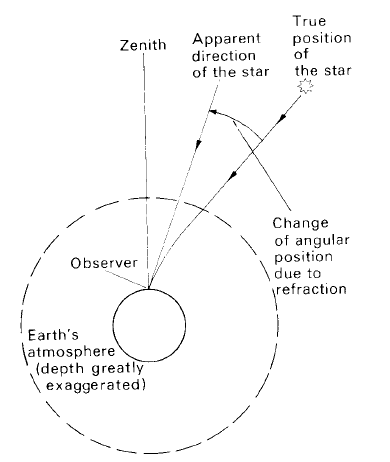
Figure 2. Displacement of the position of a star caused by refraction in the Earth’s atmosphere. (The effect is exaggerated for clarity in the diagram.)
figure 2. Lines illustrating the true direction and the apparent direction of a given star are drawn in the figure. The amount of refraction increases rapidly as the star’s position becomes closer to the observer’s horizon. At a true altitude of 1 degree, the amount of refraction is approximately a quarter of a degree. There is, however, a simple method for estimating how much a star’s position is disturbed by refraction and this can be applied to all observations.
Because of turbulence in the Earth’s atmosphere, the apparent direction of propagation moves about by small amounts in a random fashion. Normal positional measurements are, therefore, difficult to make as any image produced for positional determination will be blurred. For the optical region of the spectrum, it is in the first few hundred metres above the telescope aperture which give the greatest contribution to the blurring. It is, therefore, impossible to record a star as a point image but only as a blurred-out patch. For field imaging work this may not be too serious; it should not be difficult to find the centre of the blurred image as this would still retain circular symmetry. In the case of positional measurements by eye (no longer made by professional astronomers), the problem is more serious as the eye is trying to make an assessment of an instantaneous image which is in constant motion. In the radio region, positional measurements can also be affected by refraction in the ionosphere and in the lower atmosphere. The amount of refraction varies considerably with the wavelength of the radiation which is observed. For the refraction caused by the ionosphere, a typical value of the deviation for radiation at a frequency of 60 MHz is 20 minutes of arc at 5◦ true altitude. The refraction in the lower atmosphere is mainly due to water droplets and is hence dependent on the weather. The measured effect is approximately twice the amount which is apparent in the optical region. A typical value of the deviation is 0·◦5 at a true altitude of 1◦ and the effect increases rapidly with increasing altitude in the same way as in the case of the optical radiation.
It is obvious that all positional measurements can be improved by removing the effects of refraction and of turbulence and this can now be done by setting up equipment above the Earth’s atmosphere, in an orbiting satellite or on the Moon’s surface
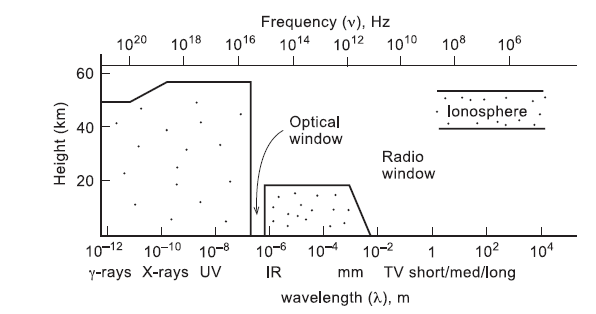
Figure 3. The windows of the Earth’s atmosphere are depicted with the source heights of the absorptions which prevent the main parts of the electromagnetic spectrum reaching the ground.
 الاكثر قراءة في مواضيع عامة في علم الفلك
 اخر الاخبار
اخبار العتبة العباسية المقدسة

الآخبار الصحية


مواضيع ذات صلة
 قسم الشؤون الفكرية يصدر كتاباً يوثق تاريخ السدانة في العتبة العباسية المقدسة
 "المهمة".. إصدار قصصي يوثّق القصص الفائزة في مسابقة فتوى الدفاع المقدسة للقصة القصيرة
 (نوافذ).. إصدار أدبي يوثق القصص الفائزة في مسابقة الإمام العسكري (عليه السلام)