
Grammar


Tenses


Present

Present Simple

Present Continuous

Present Perfect

Present Perfect Continuous


Past

Past Simple

Past Continuous

Past Perfect

Past Perfect Continuous


Future

Future Simple

Future Continuous

Future Perfect

Future Perfect Continuous


Parts Of Speech


Nouns

Countable and uncountable nouns

Verbal nouns

Singular and Plural nouns

Proper nouns

Nouns gender

Nouns definition

Concrete nouns

Abstract nouns

Common nouns

Collective nouns

Definition Of Nouns

Animate and Inanimate nouns

Nouns


Verbs

Stative and dynamic verbs

Finite and nonfinite verbs

To be verbs

Transitive and intransitive verbs

Auxiliary verbs

Modal verbs

Regular and irregular verbs

Action verbs

Verbs


Adverbs

Relative adverbs

Interrogative adverbs

Adverbs of time

Adverbs of place

Adverbs of reason

Adverbs of quantity

Adverbs of manner

Adverbs of frequency

Adverbs of affirmation

Adverbs


Adjectives

Quantitative adjective

Proper adjective

Possessive adjective

Numeral adjective

Interrogative adjective

Distributive adjective

Descriptive adjective

Demonstrative adjective


Pronouns

Subject pronoun

Relative pronoun

Reflexive pronoun

Reciprocal pronoun

Possessive pronoun

Personal pronoun

Interrogative pronoun

Indefinite pronoun

Emphatic pronoun

Distributive pronoun

Demonstrative pronoun

Pronouns


Pre Position


Preposition by function

Time preposition

Reason preposition

Possession preposition

Place preposition

Phrases preposition

Origin preposition

Measure preposition

Direction preposition

Contrast preposition

Agent preposition


Preposition by construction

Simple preposition

Phrase preposition

Double preposition

Compound preposition

prepositions


Conjunctions

Subordinating conjunction

Correlative conjunction

Coordinating conjunction

Conjunctive adverbs

conjunctions


Interjections

Express calling interjection

Phrases

Sentences


Grammar Rules

Passive and Active

Preference

Requests and offers

wishes

Be used to

Some and any

Could have done

Describing people

Giving advices

Possession

Comparative and superlative

Giving Reason

Making Suggestions

Apologizing

Forming questions

Since and for

Directions

Obligation

Adverbials

invitation

Articles

Imaginary condition

Zero conditional

First conditional

Second conditional

Third conditional

Reported speech

Demonstratives

Determiners


Linguistics

Phonetics

Phonology

Linguistics fields

Syntax

Morphology

Semantics

pragmatics

History

Writing

Grammar

Phonetics and Phonology

Semiotics


Reading Comprehension

Elementary

Intermediate

Advanced


Teaching Methods

Teaching Strategies

Assessment
Classifying Possible Causes
المؤلف:
BARBARA MINTO
المصدر:
THE MINTO PYRAMID PRINCIPLE
الجزء والصفحة:
149-9
2024-09-25
1031
Classifying Possible Causes
A third approach is to classify likely culprits by similarity, on the assumption that this pre-grouping will be helpful in synthesizing the facts. Thus, (Exhibit 42), you note that Sales can be off because of Semi-Fixed Factors or because of Variable ones. You assume Sales are off in both, and then determine what information you would have to gather to prove that (a) the falling market for the type of goods sold caused the Sales to fall off (b) store coverage does not match the market, (c) store size cuts down on volume, etc.
The trick is to create a MECE classification at the upper branch, as a guide to generating the possible causes further down. You can then formulate yes-no questions that will allow you to identify or eliminate them as causes.
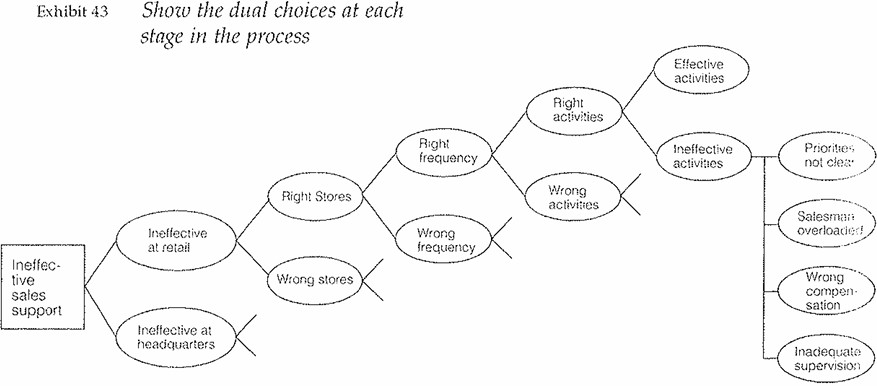
Another approach to classifying is the choice structure. This kind of tree is related to the activity structure, in that it attempts to find the causes of an undesirable effect. This time, however, you simply display dual choices mil you reach a level where you have more precise knowledge of the likely causes.
In Exhibit 43, for example, if your sales support is ineffective, it can be ineffective at retail or at headquarters. If ineffective at retail, you can be either in the right stores or in the wrong ones; if in the wrong ones, then that is the problem. If in the right ones, then either you call with the right frequency or the wrong frequency; if the right frequency, then either the activities you carry out during the call are the right ones or they are the wrong ones, etc.

The secret to this choice diagram is to visualize the sequential process involved in selling, and reflect it in your bifurcations. First you pick the store, then you call on it, then you do the right things in it, either well or poorly. The result again is an indication of the analyses that must be performed, and that will tell you how to solve the problem.
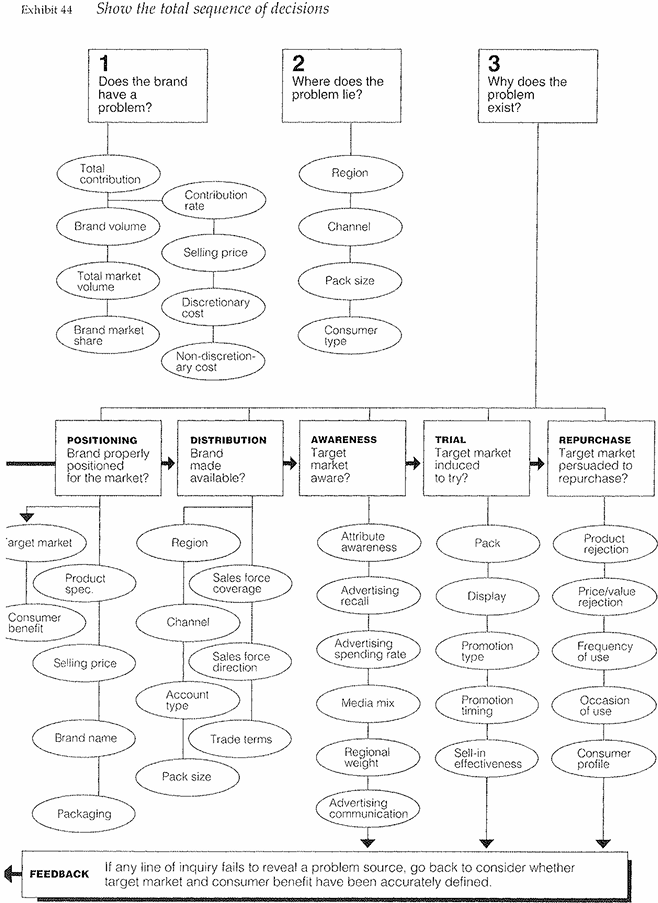
A more sophisticated version of the choice structure is the sequential marketing structure shown on the opposite page (Exhibit 44), and again I am indebted to B. Robert Holland for the example. The value of this structure lies both in its completeness and in the order in which analyses of each element are meant to be performed.
For example, your analysis might identify several indicators that your marketing program is less than adequate. Let's say the packaging is wrong, the advertising is wrongly directed, the promotion is sloppy, and those people who do buy the product don't use it frequently enough. Weaknesses identified on the left must be corrected before those on the right. Thus, there is no point in trying to coax people to use the product more frequently before you get your promotional house in order; and no point in spending money on promotion if you will continue to advertise to the wrong people.
Once you have developed a diagnostic framework, you have a wonderful explanatory vehicle for communicating with the client, in that it allows you to show him what is going on in his company, both in fact and in concept. You can let him see:
- What the structure/system looks like today as it delivers R1 (here's what's going on now)
- What logically the structure/system would have to have been to deliver the R1 they now get (here's what you must have been doing)
- What the structure/system ideally should look like to deliver the desired R2 (here's what you need to do to achieve your objective).
In the first and second cases, you can demonstrate the need for change by comparing it to the ideal. In the third, you can reveal weaknesses in the actual by matching it to the ideal.
The key thing to note about diagnostic frameworks, however, is the importance of yes-no questions. These questions serve the function of the "crucial experiments" sought by scientific problem solvers, in that their answers unambiguously identify or exclude the contributing causes of a problem. They also have the great advantage of telling you in advance when you will be finished with your research.
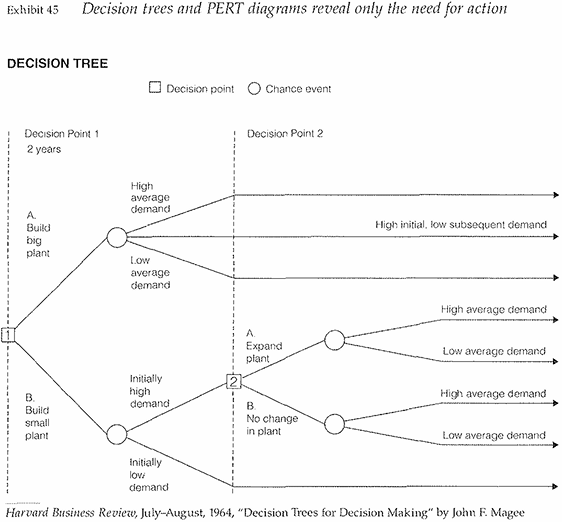
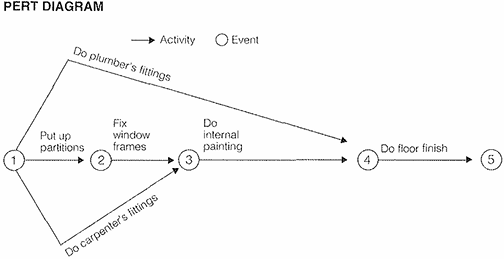
In this way diagnostic frameworks differ from and should not be confused with decision trees and PERT diagrams, which reveal the need for action as opposed to generating questions (Exhibit 45).


 الاكثر قراءة في Writing
 اخر الاخبار
اخبار العتبة العباسية المقدسة

الآخبار الصحية


 قسم الشؤون الفكرية يصدر كتاباً يوثق تاريخ السدانة في العتبة العباسية المقدسة
 "المهمة".. إصدار قصصي يوثّق القصص الفائزة في مسابقة فتوى الدفاع المقدسة للقصة القصيرة
 (نوافذ).. إصدار أدبي يوثق القصص الفائزة في مسابقة الإمام العسكري (عليه السلام)


