
علم الكيمياء

تاريخ الكيمياء والعلماء المشاهير

التحاضير والتجارب الكيميائية

المخاطر والوقاية في الكيمياء

اخرى

مقالات متنوعة في علم الكيمياء

كيمياء عامة


الكيمياء التحليلية

مواضيع عامة في الكيمياء التحليلية

التحليل النوعي والكمي

التحليل الآلي (الطيفي)

طرق الفصل والتنقية


الكيمياء الحياتية

مواضيع عامة في الكيمياء الحياتية

الكاربوهيدرات

الاحماض الامينية والبروتينات

الانزيمات

الدهون

الاحماض النووية

الفيتامينات والمرافقات الانزيمية

الهرمونات


الكيمياء العضوية

مواضيع عامة في الكيمياء العضوية

الهايدروكاربونات

المركبات الوسطية وميكانيكيات التفاعلات العضوية

التشخيص العضوي

تجارب وتفاعلات في الكيمياء العضوية


الكيمياء الفيزيائية

مواضيع عامة في الكيمياء الفيزيائية

الكيمياء الحرارية

حركية التفاعلات الكيميائية

الكيمياء الكهربائية


الكيمياء اللاعضوية

مواضيع عامة في الكيمياء اللاعضوية

الجدول الدوري وخواص العناصر

نظريات التآصر الكيميائي

كيمياء العناصر الانتقالية ومركباتها المعقدة


مواضيع اخرى في الكيمياء

كيمياء النانو

الكيمياء السريرية

الكيمياء الطبية والدوائية

كيمياء الاغذية والنواتج الطبيعية

الكيمياء الجنائية


الكيمياء الصناعية

البترو كيمياويات

الكيمياء الخضراء

كيمياء البيئة

كيمياء البوليمرات

مواضيع عامة في الكيمياء الصناعية

الكيمياء الاشعاعية والنووية
p-Functions
المؤلف:
........
المصدر:
LibreTexts Project
الجزء والصفحة:
............
21-5-2019
1805
p-Functions
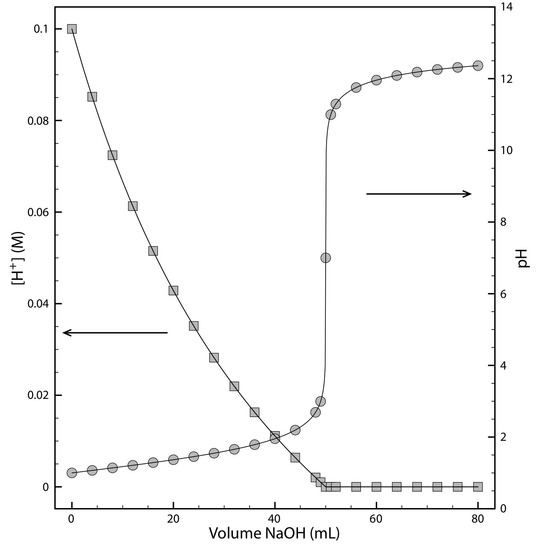
Sometimes it is inconvenient to use the concentration units during a reaction a species’ concentration may change by many orders of magnitude. If we want to display the reaction’s progress graphically we might plot the reactant’s concentration as a function of time or as a function of the volume of a reagent being added to the reaction. Such is the case in Figure 1.1 for the titration of HCl with NaOH.

Figure 1.1: Graph showing the progress for the titration of 50.0 mL of 0.10 M HCl with 0.10 M NaOH. The [H+] is shown on the left y-axis and the pH on the right y-axis.
The y-axis on the left-side of the figure displays the [H+] as a function of the volume of NaOH. The initial [H+] is 0.10 M and its concentration after adding 80 mL of NaOH is 4.3 × 10⁻¹³ M. We can easily follow the change in [H+] for the first 14 additions of NaOH. For the remaining additions of NaOH, however, the change in [H+] is too small to see.
When working with concentrations spanning many orders of magnitude, it is often more convenient to express concentration using a p-function. The p-function of X is written as pX and is defined as
The pH of a solution that is 0.10 M H+ is
and the pH of 4.3 × 10⁻¹³ M H+ is
 الاكثر قراءة في التحليل النوعي والكمي
 اخر الاخبار
اخبار العتبة العباسية المقدسة

الآخبار الصحية


 قسم الشؤون الفكرية يصدر كتاباً يوثق تاريخ السدانة في العتبة العباسية المقدسة
 "المهمة".. إصدار قصصي يوثّق القصص الفائزة في مسابقة فتوى الدفاع المقدسة للقصة القصيرة
 (نوافذ).. إصدار أدبي يوثق القصص الفائزة في مسابقة الإمام العسكري (عليه السلام)


