تاريخ الفيزياء
علماء الفيزياء


الفيزياء الكلاسيكية
الميكانيك
الديناميكا الحرارية
الكهربائية والمغناطيسية
الكهربائية
المغناطيسية
الكهرومغناطيسية
علم البصريات
تاريخ علم البصريات
الضوء
مواضيع عامة في علم البصريات
الصوت
الفيزياء الحديثة
النظرية النسبية
النظرية النسبية الخاصة
النظرية النسبية العامة
مواضيع عامة في النظرية النسبية
ميكانيكا الكم
الفيزياء الذرية
الفيزياء الجزيئية
الفيزياء النووية
مواضيع عامة في الفيزياء النووية
النشاط الاشعاعي
فيزياء الحالة الصلبة
الموصلات
أشباه الموصلات
العوازل
مواضيع عامة في الفيزياء الصلبة
فيزياء الجوامد
الليزر
أنواع الليزر
بعض تطبيقات الليزر
مواضيع عامة في الليزر
علم الفلك
تاريخ وعلماء علم الفلك
الثقوب السوداء
المجموعة الشمسية
الشمس
كوكب عطارد
كوكب الزهرة
كوكب الأرض
كوكب المريخ
كوكب المشتري
كوكب زحل
كوكب أورانوس
كوكب نبتون
كوكب بلوتو
القمر
كواكب ومواضيع اخرى
مواضيع عامة في علم الفلك
النجوم
البلازما
الألكترونيات
خواص المادة
الطاقة البديلة
الطاقة الشمسية
مواضيع عامة في الطاقة البديلة
المد والجزر
فيزياء الجسيمات
الفيزياء والعلوم الأخرى
الفيزياء الكيميائية
الفيزياء الرياضية
الفيزياء الحيوية
الفيزياء والفلسفة
الفيزياء العامة
مواضيع عامة في الفيزياء
تجارب فيزيائية
مصطلحات وتعاريف فيزيائية
وحدات القياس الفيزيائية
طرائف الفيزياء
مواضيع اخرى

Wavelength and Frequency
 المؤلف:
Professor John W. Norbury
المؤلف:
Professor John W. Norbury
 المصدر:
ELEMENTARY MECHANICS & THERMODYNAMICS
المصدر:
ELEMENTARY MECHANICS & THERMODYNAMICS
 الجزء والصفحة:
p 192
الجزء والصفحة:
p 192
 1-1-2017
 3108
3108


+
-
20
Wavelength and Frequency
There are 3 important variables for a wave, namely, i) the height y of the wave, ii) the distance x that the wave travels and iii) the time t that the wave travels. When visualizing a wave we usually think of a y - x plot or a y - t plot. The y - x plot represents an instant of time t and is similar to a photograph or snapshot of a water wave that we would take at the beach. The distance between wave crests (that we could measure from our snapshot) is called the wavelength λ. The y - t plot represents a single location x and is similar to a movie of a buoy bobbing up and down in the water as a wave passes through. The buoy is anchored to the ocean floor at a fixed distance x. The time it takes the buoy to bob up and down once is called the period T of the wave. Thus, to summarize, λ is determined from the y - x graph (instant of time t) whereas T is determined from the y - t graph (fixed distance x). Thus y is a function of both x and t, written as y(x, t). Now the y - x graph can be written

where we have taken the instant of time to be t = 0. The reason we have written sin kx and not just sin x is because the domain of the sine function is an angle. We can only ever have sin θ where θ is an angle. Thus we cannot write sin x because x is not an angle. Actually x is a distance with units of m. However we want to use x as a plotting variable. To do this we have to multiply it by something called k, so that the quantity kx is an angle, i.e. θ ≡ kx. Now what is k? Well if kx is an angle then after one complete wave cycle, the angle kx must be 2π. Now after one complete cycle the distance the wave moves is x = λ. Thus we must have

or
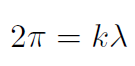
giving

which is called the wave number. Similarly, the y - t graph can be written
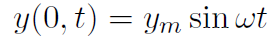
where we have taken the fixed distance to be x = 0. We did not write sin t because t is not an angle, whereas  t is an angle. is the angular speed that we have discussed before. Again after one complete wave cycle t must be 2π and after one cycle the time t will just be one period T. Thus we must have
or

giving
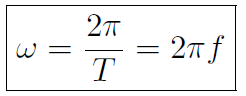
which is often called the angular frequency . We previously defined  wave can be written
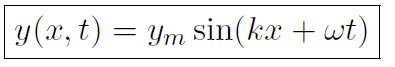
Does this agree with what we had before? Yes. We can see that y(x, 0) = ym sin kx and y(0, t) = ym sin t.
 الاكثر قراءة في الميكانيك
 اخر الاخبار
اخبار العتبة العباسية المقدسة

الآخبار الصحية


 قسم الشؤون الفكرية يصدر كتاباً يوثق تاريخ السدانة في العتبة العباسية المقدسة
 "المهمة".. إصدار قصصي يوثّق القصص الفائزة في مسابقة فتوى الدفاع المقدسة للقصة القصيرة
 (نوافذ).. إصدار أدبي يوثق القصص الفائزة في مسابقة الإمام العسكري (عليه السلام)