Qualitative analysis
Chemical identity testing of compounds is one role of the pharmaceutical spectroscopy labora tory. Testing can be accomplished with methods that utilise Raman spectroscopy. A FT-Raman method has been developed to identify the two active components (tegafur and uracil) in formulated capsules (Petty et al. 1996). The Raman spectrum of the formulated product displayed a spectral region in which Raman bands unique to uracil and tegafur were observed. The presence of these bands allowed the analyst to confirm that both components were present in the formulated product. In part because of the ease of use and chemical specificity inherent in Raman spectroscopy, it has become an essential chemical and physical identification tool for the pharmaceutical spectroscopist. Polymorphism (the ability of a molecule to crystallise in different three-dimensional structures) is a very important aspect of the drug development process. Raman spectroscopy is now being used for the qualitative and quantitative characterisation of polymorphic compounds of pharmaceutical interest. displays the Raman spectra of different polymorphs of carbamazepine.
Raman microspectroscopy is well suited for in situ analysis of contaminants found in pharmaceutical processes. The nondestructive nature of the analysis means that further experiments, such as energy-dispersive X-ray analysis or IR microspectroscopy, may be performed on the same sample. A consideration for contaminant analysis by Raman spectroscopy is the axial and spatial resolution of the technique as compared to that of IR microspectroscopy. In general, IR microspectroscopy is diffraction limited to investigating samples typically larger in size than 5 μm. As discussed earlier, with a 0.95 NA objective, 1 μm spatial resolution can be achieved with a Raman microscope, which enables the analysis of very small amounts of contaminant.
Real-time monitoring of pharmaceutically relevant processes is an exciting application for Raman spectroscopy. This has been utilised to examine synthetic organic reaction schemes to investigate kinetics, as well as to identify non-isolated reaction intermediates. Distinct advantages for Raman spectroscopy in this area are:
• ability to work with aqueous-based systems with little spectral interference from water
• utilisation of a fibre-optic probe for direct and/or remote sampling
• collection of the Raman spectrum directly through the glass vessel with little or no spectral interference
• ability to analyse the spectrum quantitatively.
Other recent applications of real-time process monitoring by Raman spectroscopy include polymorphic interconversion under slurry conditions and crystallisation monitoring (Findlay and Bugay 1998). Another exciting application of Raman spectroscopy is chemical imaging. By incorporating a programmable, xyz-movement stage into a Raman microscope, it is now possible to generate a chemical image of a two-dimensional area of a sample. With the use of a mapping stage, a sample such as a microtomed tablet can be moved in the x and y directions, obtaining spectra at each step. If the sample requires re focusing at different locations, the z-direction can be automated as well. The distance the stage moves in the x or y direction is called the step size and usually can be as small as 1 μm.
A series of images that demonstrate the dispersion of several excipients in a tablet is displayed in Figure 1. This particular area map was obtained with a step size of 4 μm, a sampling spot size of approximately 1 μm and a total sampling area of 87 μm x 52 μm. The time required to collect this map was approximately 26 hours, but not all Raman mapping experi ments require this amount of time. For example, if a map is to search for a particular component, the step size need only be on the order of the particle size of that substance. A good approach is to first obtain a larger-area map on the sample with larger step sizes and shorter sampling times per point. Once an area of interest is defined by analysing the data from the first map, a smaller, higher-resolution map can be defined. Also, area maps and imaging have experienced a recent surge in popularity, mainly because of the use of CCD array cameras and liquid crystal tuneable filter (LCTF) technology, respectively. These detectors greatly reduce the amount of time required to collect an area map (Zugates and Treado 1999). In one case, the time required to collect an area map decreased by approximately 4 hours upon switching from a CCD camera (>5 hours) to LCTF technology (<1 hour). The mapping technique can also be applied to the Raman examination of samples in 96-well plates and examination of drugs of abuse in forensic science.
Literature references of other mapping applications relative to the pharmaceutical industry include some of the following: solid dispersions of ibuprofen in polyvinylpyrrolidone (Breitenback et al. 1999), crystal formation in hormone replacement therapy patches (Armstrong et al. 1996), particle size analysis in mixtures (Theophilus and Lancaster 2000) and pharmaceutical matrix determination of dosage formulations (Clarke et al. 2000).
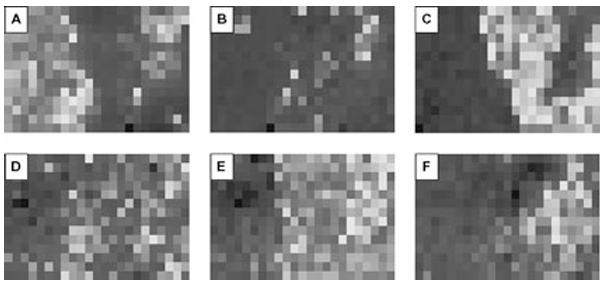
Figure 1 Peak area profiles (images) representing: (A) mannitol, (B) aspartame, (C) cellulose, (D) magnesium stearate, (E) corn starch, (F) monoammonium glycyrrhizinate.