Dispersive spectrometers
The basic configuration and components of a dispersive spectrometer are shown in Figure 2. The source of monochromatic radiation is a laser. Typically, helium–cadmium (325, 354 or 442 nm), air-cooled argon-ion (488 or 514 nm), doubled continuous-wave neodymium–yttrium aluminium garnet (Nd: YAG or Nd: Y3 Al5 O12) (532 nm), helium–neon (633 nm), or stabilised diode (785 and 830 nm) lasers are used for dispersive Raman spectrometers. The stability of the emitted radiation from a laser is one of the key attributes of a good spectrometer. Frequencystabilisation of the laser under standard laboratory conditions (slight temperature fluctuations, vibrational effects, etc.) is required. Laser life times and cost are also considerations in the choice of laser to use. One additional but very important consideration for laser selection in dispersive Raman systems is the generation of fluorescence. As stated previously, the Raman signal is fairly weak. For many organic systems, fluorescence may occur depending upon the laser used and, instead of promoting the molecule of interest to a virtual state, an electronic transition occurs with subsequent radiative decay (fluorescence, Fig. 1). The fluorescence background signal can be so intense as to mask the Raman scattered photons. Fluorescence is wavelength dependent, so a sample that fluoresces with one laser source may not with another. If fluorescence does not pose a problem, lower-frequency lasers can be used (532, 514 nm) for enhanced sensitivity, as the efficiency of Raman scattering is proportional to 1/(λ)4, where k is the wavelength. If fluorescence is a problem when using these high-energy sources, then lower-energy sources, such as those used in FT based Raman spectroscopy, can be used to minimise the fluorescence affects.
In a dispersive Raman spectrometer, the sample is positioned in the laser beam and the scattering radiation collected in either a 180 backscattering or a 90 right-angle scattering configuration. Subsequently, a laser-line rejection filter is put in place to filter out the Rayleigh scattering. Finally, a detector is positioned in the spectrometer. For dispersive systems, typically a charge-coupled device (CCD) is utilised. Silicon CCD detectors are normally used for Raman spectrometers in which visible wavelength lasers are used. Previously, photomultiplier tubes (PMTs) were used for detection, but since the advent of CCDs and because of their inherently better performance, PMTs are no longer normally used. Unfortunately, CCD detectors are sensitive to cosmic rays, which add artefacts to the spectra; these artefacts can be removed via software methods. All commercial spectrometers are controlled digitally by a computer system.
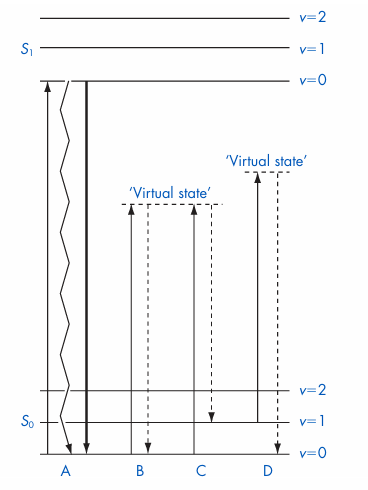
Figure 1 Jablonski energy level diagram illustrating possible transitions. Solid lines represent absorption processes and dotted lines represent scattering processes. A, electronic transition with nonradiative decay (heat, zig zag line) or radiative decay (fluorescence, thick line); B, Rayleigh scattering; C, Stokes Raman transition; D, anti Stokes Raman transition. S0 is the singlet ground state, S1 the lowest singlet excited state and v represents vibrational energy levels within each electronic state.
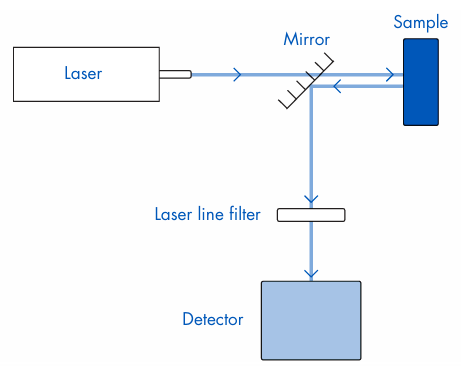
Figure 2 A dispersive Raman spectrometer.