تاريخ الفيزياء
علماء الفيزياء


الفيزياء الكلاسيكية
الميكانيك
الديناميكا الحرارية
الكهربائية والمغناطيسية
الكهربائية
المغناطيسية
الكهرومغناطيسية
علم البصريات
تاريخ علم البصريات
الضوء
مواضيع عامة في علم البصريات
الصوت
الفيزياء الحديثة
النظرية النسبية
النظرية النسبية الخاصة
النظرية النسبية العامة
مواضيع عامة في النظرية النسبية
ميكانيكا الكم
الفيزياء الذرية
الفيزياء الجزيئية
الفيزياء النووية
مواضيع عامة في الفيزياء النووية
النشاط الاشعاعي
فيزياء الحالة الصلبة
الموصلات
أشباه الموصلات
العوازل
مواضيع عامة في الفيزياء الصلبة
فيزياء الجوامد
الليزر
أنواع الليزر
بعض تطبيقات الليزر
مواضيع عامة في الليزر
علم الفلك
تاريخ وعلماء علم الفلك
الثقوب السوداء
المجموعة الشمسية
الشمس
كوكب عطارد
كوكب الزهرة
كوكب الأرض
كوكب المريخ
كوكب المشتري
كوكب زحل
كوكب أورانوس
كوكب نبتون
كوكب بلوتو
القمر
كواكب ومواضيع اخرى
مواضيع عامة في علم الفلك
النجوم
البلازما
الألكترونيات
خواص المادة
الطاقة البديلة
الطاقة الشمسية
مواضيع عامة في الطاقة البديلة
المد والجزر
فيزياء الجسيمات
الفيزياء والعلوم الأخرى
الفيزياء الكيميائية
الفيزياء الرياضية
الفيزياء الحيوية
الفيزياء والفلسفة
الفيزياء العامة
مواضيع عامة في الفيزياء
تجارب فيزيائية
مصطلحات وتعاريف فيزيائية
وحدات القياس الفيزيائية
طرائف الفيزياء
مواضيع اخرى

Orbital curvatures
 المؤلف:
Heino Falcke and Friedrich W Hehl
المؤلف:
Heino Falcke and Friedrich W Hehl
 المصدر:
THE GALACTIC BLACK HOLE Lectures on General Relativity and Astrophysics
المصدر:
THE GALACTIC BLACK HOLE Lectures on General Relativity and Astrophysics
 الجزء والصفحة:
p 237
الجزء والصفحة:
p 237
 5-2-2017
 2175
2175


+
-
20
Orbital curvatures
For three sources S1, S2 and S8 we have detected a curvature in the orbits on the 1.5σ to 3σ level. In figure 1.1 we show the offset positions for S2 in declination and right ascension as a function of time. The linear fits to the first and second half of the data set clearly result in different slopes. Their difference divided by the time difference between the two intervals is a direct measure of the orbital curvature. In order to improve the statistics on an estimate of the accelerations we have used velocities derived from data covering different time intervals (Eckart et
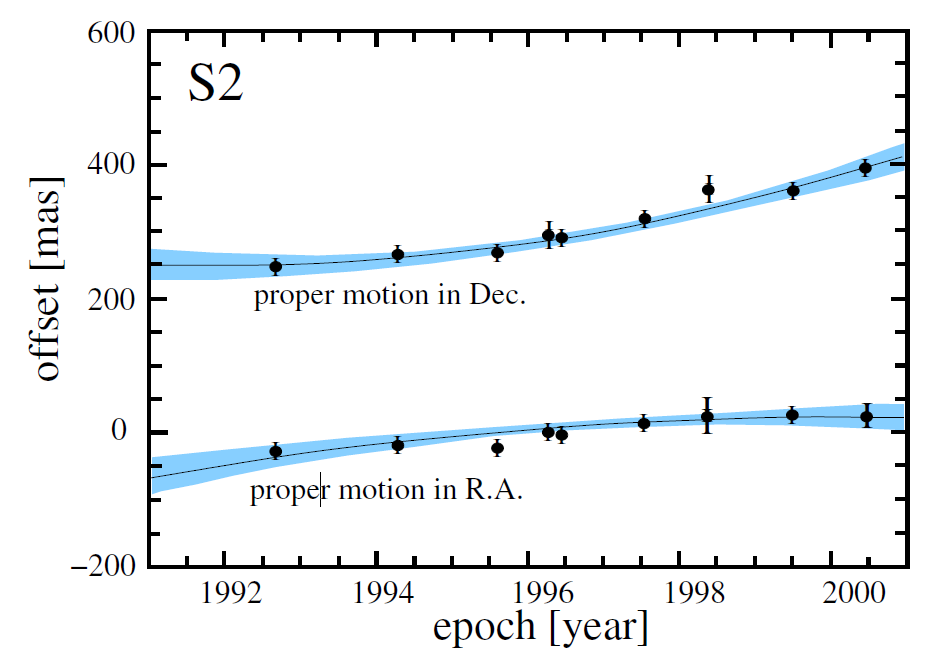
Figure 1.1. The relative positions of S2 in declination and right ascension as a function of the observing epoch. The declination velocity plot has been shifted by +300 km s−1.
al 2001, 2002). For S2 we find a curvature of 2.3 ± 0.9 mas yr−2 corresponding to an acceleration of 95 km s−1 yr−1. For S1 and S8 we find a curvature of 3.8 ± 2.4 mas yr−2 and 3.3 ± 1.1 mas yr−2, respectively. The slopes are in agreement with those expected from fits of Keplerian orbits to the data (for S2 see figures 1.1 and 1.2). As an example the SHARP data now start to constrain the possible orbits for S2. For S2 a likely solution (obtained from least-square fits of Keplerian orbits to the data) is that this star has a line-of-sight offset of 8–9 mpc and a line-of-sight velocity in the range of −200 to −600 km s−1. Due to current uncertainties in the inclination a combination of −8 to −9 mpc and 200-600 km s−1 is possible as well. Three possible orbits that represent good fits to the data are shown in figure 1.2. The current data and analysis indicate that S2 is aproaching its periastron.
The accelerations from the SHARP experiment (Eckart et al 2001, 2002) are consistent with recent results by Ghez et al (2000) and imply that the three stars orbit a central, compact mass (see figure 1.3).
Star S8 was excluded from the analysis, since the current proper motion velocity and radial separation from the center indicate that the measured acceleration requires orbital motion around a compact object with a mass in excess of 3 × 10⁶ Mּ. The data suggest that either this star was or is subject to a close interaction with a different object or that its position measurements are influenced by the emission of a different cluster star. Therefore, the analysis of the enclosed mass is solely based on the available data for S1 and S2. For each of
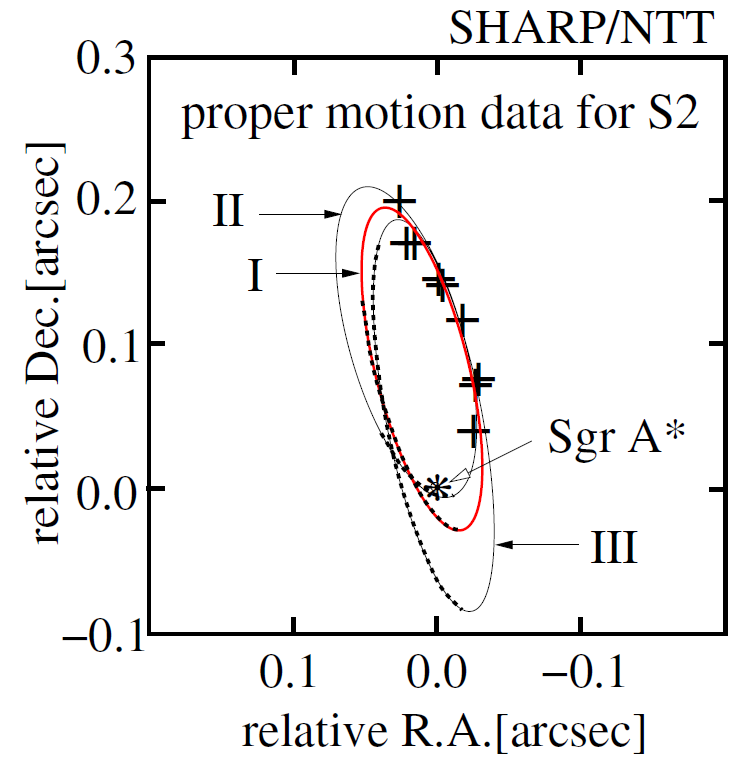
Figure 1.2. Three inclined Keplerian orbits that have line of sight velocities and separations from Sgr A∗ as mentioned in the text. The orbits represent the range of best fits to the 1992 to 2000 SHARP data for the fast moving source S2. From the proper motions alone we find a velocity of greater than 860 km s−1 the results of the orbit modeling suggest a full space velocity of up to ∼1050 km s−1.
the two sources S1 and S2 the acceleration values define an acceleration vector at an angle φ that should point towards the central source. Here we assume that the probability for the location of the central mass is uniform in φ. In figure 1.3 the stars S1 and S2 have been plotted at their time-averaged position resulting from the corresponding data sets. The measurement uncertainties define an error cone. For the presentation in figure 1.3 the dashed and dotted lines indicate an error cone that corresponds to a width of 2σ in deviation from the nominal direction indicated by the acceleration vector. In order to determine the location of the central mass we perform a maximum likelihood (ML) analysis. As an ML score we use log(ML) = −χ2S1/2−χ2S2/2. The thin contour lines in figure 8.6 indicate the locations at which log(ML) drops by 0.5 below the corresponding peak values. Here χ2 = (φ − φ0)2/(Δφ)2, φ0 denotes the angle of the acceleration vector, φ the angle of any radial line within an error cone, and Δφ = σ the half-width of the cone. The central filled circle in figure 1.3 marks the radio position of Sgr A* and corresponding uncertainties of ±30 mas. Using the observed curvature value and the enclosed mass range of 2.6-3.3 × 10⁶ Mּ imposes a limit on the projected
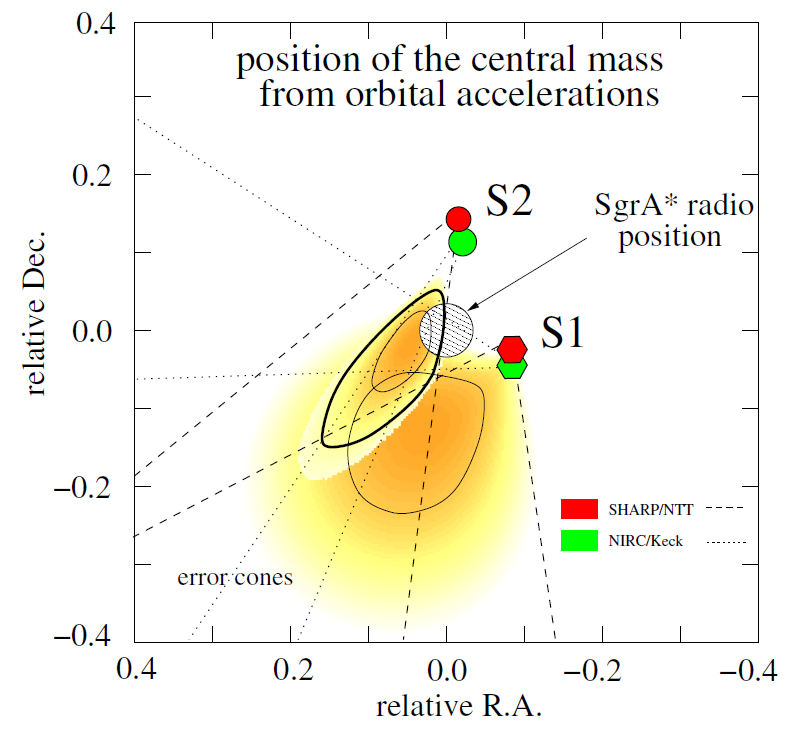
Figure 1.3. The acceleration vectors of the sources S1, S2 as derived from the current SHARP data. An explanation of the symbols is given in the text. The motion of the stars is consistent with orbits around a central 3 × 10⁶Mּ object.
distance of S1 and S2 from Sgr A*. For the SHARP/NTT data this leads to an improvement in the determination of the Sgr A* position. We account for this effect in figure 1.3 by multiplying the log(ML) scores of the error cones with a Gaussian prior of the appropriate 1/e width centered on the time-averaged positions of S1 and S2. From the projection of the 1σ contour line (thin contour line east of the center in figure 1.3) the multiplied probabilities derived from the SHARP/NTT and NIRC/Keck data result in a position of a central dark mass of 48+54−24 mas E and 18+42−61 mas S of the nominal radio position of Sgr A*. Within these limits the central mass is located at the 68.5% confidence level (Δχ = 1.0). At the 90% confidence level (Δχ = 2.71) the central mass is located in an interval given by 48+109−48 mas E and 18+72−133 mas S (thick contour line left of the center in figure 1.3). Figure 1.3 shows that at the current ±30 mas uncertainty of the radio position of Sgr A* the presently available accelerations of stars S1 and S2 alone are fully consistent with the hypothesis that the radio source Sgr A* is coincident with the center of the dark mass.
 الاكثر قراءة في مواضيع عامة في علم الفلك
 اخر الاخبار
اخبار العتبة العباسية المقدسة

الآخبار الصحية


مواضيع ذات صلة
 قسم الشؤون الفكرية يصدر كتاباً يوثق تاريخ السدانة في العتبة العباسية المقدسة
 "المهمة".. إصدار قصصي يوثّق القصص الفائزة في مسابقة فتوى الدفاع المقدسة للقصة القصيرة
 (نوافذ).. إصدار أدبي يوثق القصص الفائزة في مسابقة الإمام العسكري (عليه السلام)