
تاريخ الرياضيات

الاعداد و نظريتها

تاريخ التحليل

تار يخ الجبر

الهندسة و التبلوجي


الرياضيات في الحضارات المختلفة

العربية

اليونانية

البابلية

الصينية

المايا

المصرية

الهندية


الرياضيات المتقطعة

المنطق

اسس الرياضيات

فلسفة الرياضيات

مواضيع عامة في المنطق


الجبر

الجبر الخطي

الجبر المجرد

الجبر البولياني

مواضيع عامة في الجبر

الضبابية

نظرية المجموعات

نظرية الزمر

نظرية الحلقات والحقول

نظرية الاعداد

نظرية الفئات

حساب المتجهات

المتتاليات-المتسلسلات

المصفوفات و نظريتها

المثلثات


الهندسة

الهندسة المستوية

الهندسة غير المستوية

مواضيع عامة في الهندسة

التفاضل و التكامل


المعادلات التفاضلية و التكاملية

معادلات تفاضلية

معادلات تكاملية

مواضيع عامة في المعادلات


التحليل

التحليل العددي

التحليل العقدي

التحليل الدالي

مواضيع عامة في التحليل

التحليل الحقيقي

التبلوجيا

نظرية الالعاب

الاحتمالات و الاحصاء

نظرية التحكم

بحوث العمليات

نظرية الكم

الشفرات

الرياضيات التطبيقية

نظريات ومبرهنات


علماء الرياضيات

500AD

500-1499

1000to1499

1500to1599

1600to1649

1650to1699

1700to1749

1750to1779

1780to1799

1800to1819

1820to1829

1830to1839

1840to1849

1850to1859

1860to1864

1865to1869

1870to1874

1875to1879

1880to1884

1885to1889

1890to1894

1895to1899

1900to1904

1905to1909

1910to1914

1915to1919

1920to1924

1925to1929

1930to1939

1940to the present

علماء الرياضيات

الرياضيات في العلوم الاخرى

بحوث و اطاريح جامعية

هل تعلم

طرائق التدريس

الرياضيات العامة

نظرية البيان
Solving Systems of Inequalities
المؤلف:
المرجع الالكتروني للمعلوماتيه
المصدر:
www.almerja.com
الجزء والصفحة:
...
8-3-2017
1799
We first need to learn the symbols for inequalities:
The symbol < means less than.
The symbol > means greater than.
The symbol < with a bar underneath means less than or equal to. Usually this is written as <= on computers because it is simple to write and understand.
The symbol > with a bar underneath means greater than or equal to. Usually this is written as >= on computers because it is simple to write and understand.
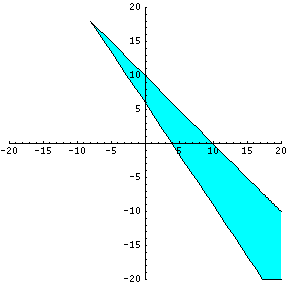
There are endless solutions for inequalities. In light of this fact, it is best to find a solution set for inequalities by solving the system graphically.
How To Solve Systems of Inequalities Graphically:
1) Write the inequality in slope-intercept form or in the form y = mx + b.
Sample A: Solve x + y <=10.
Firstly, x + y < = 10 becomes y <= -x + 10.
2) Temporarily exchange the given inequality symbol (in this case <=) for the equal symbol. In doing so, you can treat the inequality like an equation. BUT DO NOT forget to replace the equal symbol with the original inequality symbol at the END of the problem.
So, y <= -x + 10 becomes y = -x + 10.
3) Plug different values for x to find points that will be graphed in the form (x,y).
When x = 1, y = 9
When x = 0, y = 10
When x = 4, y = 6
When x = 6, y = 4
The following points will be graphed on the xy-plane:
(1,9), (0,10), (4,6) and (6,4)

NOTE:
Points ABOVE the graph line represent all points where
y > -x + 10. Points BELOW the graph line (shaded) represent all points where y < -x + 10.
For our Sample A question, y <= -x + 10, all points on or below the graph line satisfy the original inequality. This means that if you were to select points on or below the graph line and plug those points into the original inequality, the inequality will reveal a TRUE statement. I will try one and you can look for more points if you'd like.
I will plug point (-2,2) into the original inequality to test if point (-2,2) will yield a true statement.
Our original inequality is:
x + y <= 10.
(-2) + (2) <= 10
0 <= 10 is a TRUE statement.
Thus, we now know that every point below the graph line will satisfy the inequality. You may select any point on this graph line for further testing if you'd like.
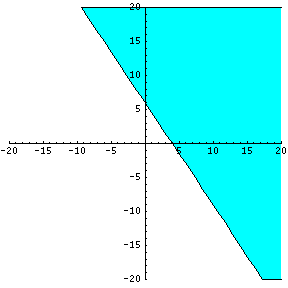
Sample B: Solve y >= -3/2x + 6
Notice that this inequality is already in the slope-intercept form.
I will replace the given inequality symbol for the equal symbol.
So, y >= -3/2x + 6 becomes y = -3/2x + 6.
I will now plug different values for x to find y and thus create points in the form (x,y).
When x = 1, y = 4.5
When x = 2, y = 3
When x = 3, y = 1.5
When x = 4, y = 0
Our points to be graphed:
(1,4.5), (2,3), (3,1.5) and (4,0)

After applying basic algebra, we learn that all points on or ABOVE this graph line will satisfy our second original inequality. Again, I will select any point above the graph line to make sure that it will satisfy or reveal a TRUE statement in terms of the original inequality in our Sample B.
I will use point (5,3).
Our original inequality is:
y >= -3/2x + 6
3 >= -3/2(5) + 6
3 >= -1.5. This is a TRUE statement and thus, point (5,3), which is above the graph line, satisfies our original inequality.

 الاكثر قراءة في مواضيع عامة في الجبر
 اخر الاخبار
اخبار العتبة العباسية المقدسة

الآخبار الصحية


 قسم الشؤون الفكرية يصدر كتاباً يوثق تاريخ السدانة في العتبة العباسية المقدسة
 "المهمة".. إصدار قصصي يوثّق القصص الفائزة في مسابقة فتوى الدفاع المقدسة للقصة القصيرة
 (نوافذ).. إصدار أدبي يوثق القصص الفائزة في مسابقة الإمام العسكري (عليه السلام)


