

النبات

مواضيع عامة في علم النبات

الجذور - السيقان - الأوراق

النباتات الوعائية واللاوعائية

البذور (مغطاة البذور - عاريات البذور)

الطحالب

النباتات الطبية


الحيوان

مواضيع عامة في علم الحيوان

علم التشريح

التنوع الإحيائي

البايلوجيا الخلوية


الأحياء المجهرية

البكتيريا

الفطريات

الطفيليات

الفايروسات


علم الأمراض

الاورام

الامراض الوراثية

الامراض المناعية

الامراض المدارية

اضطرابات الدورة الدموية

مواضيع عامة في علم الامراض

الحشرات


التقانة الإحيائية

مواضيع عامة في التقانة الإحيائية


التقنية الحيوية المكروبية

التقنية الحيوية والميكروبات

الفعاليات الحيوية

وراثة الاحياء المجهرية

تصنيف الاحياء المجهرية

الاحياء المجهرية في الطبيعة

أيض الاجهاد

التقنية الحيوية والبيئة

التقنية الحيوية والطب

التقنية الحيوية والزراعة

التقنية الحيوية والصناعة

التقنية الحيوية والطاقة

البحار والطحالب الصغيرة

عزل البروتين

هندسة الجينات


التقنية الحياتية النانوية

مفاهيم التقنية الحيوية النانوية

التراكيب النانوية والمجاهر المستخدمة في رؤيتها

تصنيع وتخليق المواد النانوية

تطبيقات التقنية النانوية والحيوية النانوية

الرقائق والمتحسسات الحيوية

المصفوفات المجهرية وحاسوب الدنا

اللقاحات

البيئة والتلوث


علم الأجنة

اعضاء التكاثر وتشكل الاعراس

الاخصاب

التشطر

العصيبة وتشكل الجسيدات

تشكل اللواحق الجنينية

تكون المعيدة وظهور الطبقات الجنينية

مقدمة لعلم الاجنة


الأحياء الجزيئي

مواضيع عامة في الاحياء الجزيئي


علم وظائف الأعضاء


الغدد

مواضيع عامة في الغدد

الغدد الصم و هرموناتها

الجسم تحت السريري

الغدة النخامية

الغدة الكظرية

الغدة التناسلية

الغدة الدرقية والجار الدرقية

الغدة البنكرياسية

الغدة الصنوبرية

مواضيع عامة في علم وظائف الاعضاء

الخلية الحيوانية

الجهاز العصبي

أعضاء الحس

الجهاز العضلي

السوائل الجسمية

الجهاز الدوري والليمف

الجهاز التنفسي

الجهاز الهضمي

الجهاز البولي


المضادات الميكروبية

مواضيع عامة في المضادات الميكروبية

مضادات البكتيريا

مضادات الفطريات

مضادات الطفيليات

مضادات الفايروسات

علم الخلية

الوراثة

الأحياء العامة

المناعة

التحليلات المرضية

الكيمياء الحيوية

مواضيع متنوعة أخرى

الانزيمات
Immunoprecipitation
المؤلف:
Clive Dennison
المصدر:
A guide to protein isolation
الجزء والصفحة:
20-4-2016
5952
Immunoprecipitation
Immunoprecipitation is the basis of a number of analytical techniques, which will be discussed below. Many of these techniques are very ingenious, but they are now mostly of historical interest only. The reason is that immunoprecipitation requires relatively large amounts of antibody and antigen in order to form a visible immunoprecipitate, i.e. it is not a very sensitive technique, and so it has largely been replaced by techniques which involve an amplification step to make the Ab/Ag reaction more easily detected.
The paratope of an antibody and the complementary epitope on an antigen have a very specific stereo relationship with one another. If an antigen contains at least two epitopes, it may form a precipitate upon reaction with its specific (polyclonal) antibodies at optimal proportions. Monoclonal or peptide antibodies, which target only a single epitope, will not form an immunoprecipitate, as they will not be able to form the extended network necessary. The mechanism of formation of an immunoprecipitate is shown in Fig. 1. Formation of the matrix required for immunoprecipitation requires at least two epitopes, each targeted by a different antibody.
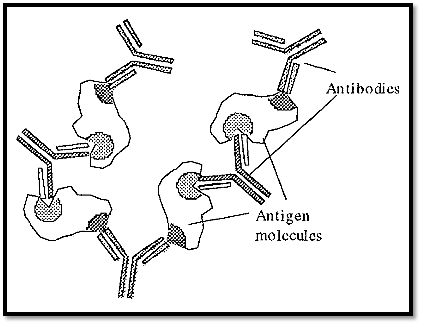
Figure 1. The formation of an immunoprecipitate.
Formation of an immunoprecipitate requires optimal proportions of antibodies and antigen and if either the antibody or the antigen .

Figure 2. Formation of soluble complexes in the presence of an excess of antigen.
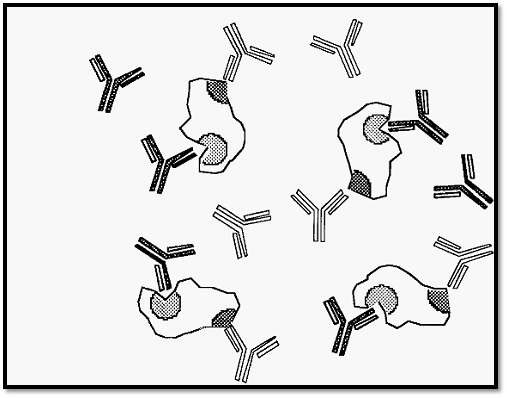
Figure 3. Formation of soluble complexes in the presence of an excess of antibody.
The dependence of immunoprecipitation on the proportions of Ab and Ag can be expressed graphically, as in Fig. 4.
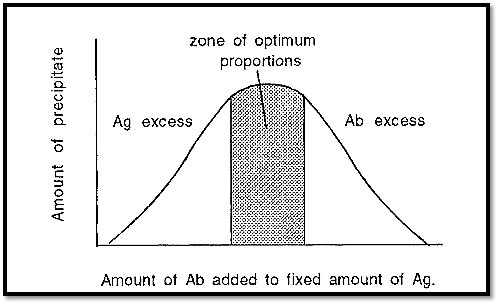
Figure 4. Immunoprecipitation at different proportions of Ab and Ag.
Often, with a novel combination of Ag and Ab, the optimal concentrations are not known. This has led to the use of diffusion techniques, where the diffusion of either the Ab or the Ag generates a concentration gradient of that molecule. The optimal concentration will occur somewhere along the concentration gradient and will lead to formation of an immunoprecipitate at that point.
Immunoprecipitation is also affected by pH and in general precipitation will not occur substantially outside of the range pH 5→9 .
1- Immuno single diffusion
Immunodiffusion is usually conducted in macroreticular agarose gels, which serve to stabilize the system against flow-induced disturbances, such as convection, but do not impede diffusion. In immuno single diffusion, the one component is present throughout the gel at a constant concentration, while the other component diffuses into the gel from solution. In immuno single diffusion, the precipitate band moves further into the gel with time, due to the continual diffusion into the gel of the component originally present in solution. The precipitate band also tends to be indistinct as it is spread over an area, with the precipitate band being formed on its leading edge and redissolving on the trailing edge. This “fuzziness” of the bands makes it difficult to determine how many precipitate bands there may be.
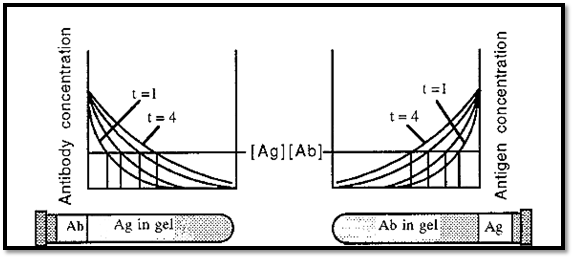
Figure 5. Immuno single diffusion.
The Ag or the Ab is present throughout the gel at a constant concentration and theothercomponent is allowed to diffuse into the gel from solution, where it is present at a higher concentration. Immunoprecipitation will occur at the positions where the Ab and Ag are present in equivalent concentrations (indicated by the vertical lines in Fig. 5). As the one component will continue to diffuse into the gel over time, the position of the immunoprecipitate will move further into the gel with time and the precipitate will not form a sharp line, as it will be re-dissolving on one edge and precipitating on the other.
1.1 Mancini radial diffusion
A practical, quantitative, single diffusion system is Mancini radial diffusion. In this method the Ab is added to the gel and the Ag to a well cut into the gel. The Ag diffuses into the gel and forms a precipitate where it meets the Ab in optimal proportions, forming a circular precipitin line surrounding the central well. With time, the circular precipitate will grow in diameter until the supply of Ag is exhausted, at which point the growth in diameter ceases. The method gives a quantitative measure of the amount of Ag, because the more there is, the larger will be the diameter of the circle of the precipitin band surrounding the central well. A standard curve can be constructed from the diameters obtained with known concentrations of a standard Ag, and this can be used to determine the concentration of an unknown, from the diameter of its precipitin circle.
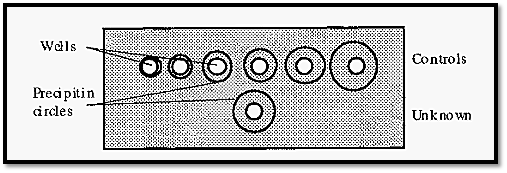
Figure 6. Mancini radial diffusion.
2- Immuno double diffusion
The limitations of immuno single diffusion can be overcome by using immuno double diffusion. In this case the Ab and the Ag diffuse into opposite ends of the gel and form a precipitate where they meet in equivalent concentrations. With time, the position of the immunoprecipitate will not change, but simply more precipitate will form
at the same position as the Ab and Ag continue to diffuse into the gel (Fig. 7). This is assuming that the Ab and Ag continue to diffuse at the same relative rate, which they will do if the temperature is kept constant. If there is more than one antigen/antibody couple present, then each of these systems will form their own precipitate band. If the antigens are of different sizes or shapes, they will diffuse at different rates and will form precipitate bands, at different places. (IgG antibodies are all of the same size and gross shape and so will all diffuse at the same rate).
Because the precipitate band(s) formed by double diffusion are very sharp, different bands are easily distinguished from one another and so it is relatively easy to determine how many bands have been formed.
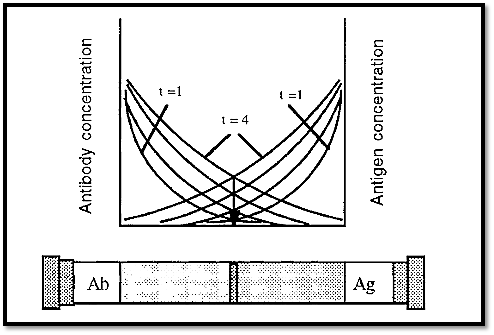
Figure 7. Immuno double diffusion.
2.1 Ouchterlony double diffusion analysis
Although the concentration gradients formed during immuno double diffusion enable the Ab and Ag to “find” one another at optimal proportions, sometimes the starting concentration of either the Ab or the Ag is out of range, i.e. is too high or too low, and so it is necessary, with an unknown system, to repeat the experiment using different Ab and Ag concentrations. An efficient way of doing this was devised by Ouchterlony. In this method the gel is cast as a layer,1 →1.5 mm thick, on a support (a Petrie dish is convenient) and a pattern of wells (Fig. 8) is cut into it using a die and template. Ab and Ag are added to appropriate wells; typically, Ag may be added to the central well and a serial dilution of Ab added to the surrounding wells.
Fig. 8 shows a single central well surrounded by six circumferential wells, but the Ouchterlony technique is not limited to this arrangement. The pattern can be extended ad infinitum, to accommodate different Ab/Ag concentrations.
The serial dilution series is conveniently constructed in the wells of a microtitre plate. A constant volume, say 100 µl, is added to 5 wells of the plate, 100 µl of antiserum is added to the first well and mixed in, 100 µl of this mixture is transferred to the next well, mixed in, and 100 µl transferred to the next well etc., until the last well contains 200 µl of mixture containing 1/32 of the original concentration of Ab.
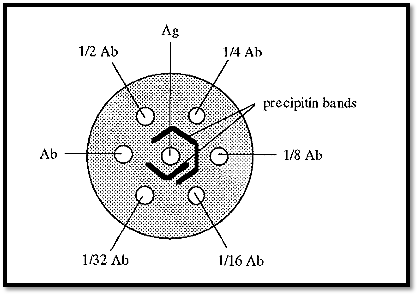
Figure 8. Ouchterlony double diffusion.
Three practical points must be borne in mind:-
• Development of the precipitin bands must be done at a constant temperature, usually 37C, to prevent changes in diffusion rates, which can give rise to indistinct bands.
• To prevent the gel from drying out, it must be incubated in a sealed container with an atmosphere saturated with water vapour. A Tupperware-type container, containing several sheets of filter paper, saturated with water, is suitable.
• The gel and the Ag and Ab solutions must contain a preservative, such as merthiolate, to prevent microbial growth. A moist environment, at 37C, in the presence of protein (the Ab and Ag) and carbohydrate (the agarose gel) is ideal for microbial growth.
Ouchterlony double-diffusion can be used in a test of identity of two antigens. If these are identical, their immunoprecipitin lines will fuse into a single line (Fig. 9 a) whereas if they are non-identical their precipitin lines will cross (Fig. 9 b). Partial identity is indicated by a fused arc, with a spur (Fig. 9 c).

Figure 9. Test of identity using immuno double diffusion.
2.2 Determination of diffusion coefficients
As mentioned above, the development of different precipitin bands in double diffusion is due to differences in the rate of diffusion of different antigens, which is reflected in their different diffusion coefficients. Diffusion coefficients give information about the size and shape of molecules. Because the position of the precipitin band is a function of the diffusion coefficient of the antigen, immunodiffusion can be used to measure diffusion coefficients.
One such method, devised by Polson8, uses a device which Polson refers to as his “mouth organ” apparatus (Fig. 9). This consists of four Perspex blocks, marked A, B, C and D, with holes drilled through three of them and part way into D. The blocks are able to slide relative to one another on joints greased with petroleum jelly.
With the blocks aligned, a serial dilution of Ab can be introduced into the wells in block D after which block D is moved to one side to seal the wells. Molten 1% agarose is introduced into the wells in block C and sealed off by moving blocks A and B to one side, before the agarose sets. Finally, Ag is added to the wells in block B and sealed off by moving block A to one side.
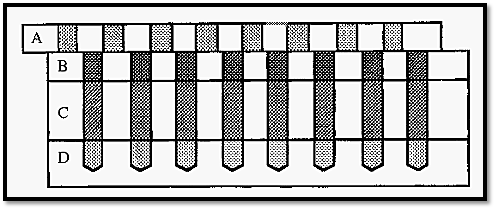
Figure 10. Polsons mouth organ apparatus for the determination of diffusion coefficients by immunodiffusion.
The apparatus is incubated at 37C and Ab and Ag diffuse through the column of agarose, of known precise dimensions, to form a sharp precipitin band where they meet in optimal proportions. Where the proportions are not optimal the bands are relatively fuzzy (Fig. 10).

Figure 11. Quantitative immunodiffusion in Polsons apparatus.
From the column in which the precipitin band is most sharp, the measurements Xg and Xb are taken (Fig. 10b). From these the diffusion coefficient of the Ag can be calculated by substitution in the equation:-

Where,
Dg = diffusion coefficient of the antigen,
Db = diffusion coefficient of the antibody
Since all IgG molecules have essentially the same gross structure, they will all have the same diffusion coefficient. Db is thus a constant (4.6 x 10⁻⁷ cm2 sec-1.
Diffusion coefficients can also be measured by molecular exclusion chromatography, since the separating mechanism in this technique is also diffusion dependent. A standard curve of 1/D vs Kav, constructed using proteins of known diffusion coefficient (D), can be used to determine the diffusion coefficients of unknowns. It is useful to have two independent measures of the diffusion coefficient - in this case by immunodiffusion and MEC - as the results from the different methods serve as a check on one another.
References
Dennison, C. (2002). A guide to protein isolation . School of Molecular mid Cellular Biosciences, University of Natal . Kluwer Academic Publishers new york, Boston, Dordrecht, London, Moscow .
 الاكثر قراءة في عزل البروتين
 اخر الاخبار
اخبار العتبة العباسية المقدسة

الآخبار الصحية


 قسم الشؤون الفكرية يصدر كتاباً يوثق تاريخ السدانة في العتبة العباسية المقدسة
 "المهمة".. إصدار قصصي يوثّق القصص الفائزة في مسابقة فتوى الدفاع المقدسة للقصة القصيرة
 (نوافذ).. إصدار أدبي يوثق القصص الفائزة في مسابقة الإمام العسكري (عليه السلام)


