

النبات

مواضيع عامة في علم النبات

الجذور - السيقان - الأوراق

النباتات الوعائية واللاوعائية

البذور (مغطاة البذور - عاريات البذور)

الطحالب

النباتات الطبية


الحيوان

مواضيع عامة في علم الحيوان

علم التشريح

التنوع الإحيائي

البايلوجيا الخلوية


الأحياء المجهرية

البكتيريا

الفطريات

الطفيليات

الفايروسات


علم الأمراض

الاورام

الامراض الوراثية

الامراض المناعية

الامراض المدارية

اضطرابات الدورة الدموية

مواضيع عامة في علم الامراض

الحشرات


التقانة الإحيائية

مواضيع عامة في التقانة الإحيائية


التقنية الحيوية المكروبية

التقنية الحيوية والميكروبات

الفعاليات الحيوية

وراثة الاحياء المجهرية

تصنيف الاحياء المجهرية

الاحياء المجهرية في الطبيعة

أيض الاجهاد

التقنية الحيوية والبيئة

التقنية الحيوية والطب

التقنية الحيوية والزراعة

التقنية الحيوية والصناعة

التقنية الحيوية والطاقة

البحار والطحالب الصغيرة

عزل البروتين

هندسة الجينات


التقنية الحياتية النانوية

مفاهيم التقنية الحيوية النانوية

التراكيب النانوية والمجاهر المستخدمة في رؤيتها

تصنيع وتخليق المواد النانوية

تطبيقات التقنية النانوية والحيوية النانوية

الرقائق والمتحسسات الحيوية

المصفوفات المجهرية وحاسوب الدنا

اللقاحات

البيئة والتلوث


علم الأجنة

اعضاء التكاثر وتشكل الاعراس

الاخصاب

التشطر

العصيبة وتشكل الجسيدات

تشكل اللواحق الجنينية

تكون المعيدة وظهور الطبقات الجنينية

مقدمة لعلم الاجنة


الأحياء الجزيئي

مواضيع عامة في الاحياء الجزيئي


علم وظائف الأعضاء


الغدد

مواضيع عامة في الغدد

الغدد الصم و هرموناتها

الجسم تحت السريري

الغدة النخامية

الغدة الكظرية

الغدة التناسلية

الغدة الدرقية والجار الدرقية

الغدة البنكرياسية

الغدة الصنوبرية

مواضيع عامة في علم وظائف الاعضاء

الخلية الحيوانية

الجهاز العصبي

أعضاء الحس

الجهاز العضلي

السوائل الجسمية

الجهاز الدوري والليمف

الجهاز التنفسي

الجهاز الهضمي

الجهاز البولي


المضادات الحيوية

مواضيع عامة في المضادات الحيوية

مضادات البكتيريا

مضادات الفطريات

مضادات الطفيليات

مضادات الفايروسات

علم الخلية

الوراثة

الأحياء العامة

المناعة

التحليلات المرضية

الكيمياء الحيوية

مواضيع متنوعة أخرى

الانزيمات
Assays for activity of peroteins
المؤلف:
Clive Dennison
المصدر:
A guide to protein isolation
الجزء والصفحة:
13-4-2016
2100
Assays for activity of peroteins
Most proteins have some form of unique functional activity, which defines the specific protein and may be used to elaborate an assay for its detection and quantitation. A philosophical point to note is that it is necessary to conceive of an activity and to devise an appropriate assay, before the protein can be isolated. Ideally, the assay should be:-
• specific, to define the protein of interest and distinguish it from all others,
• Quantitative, so that the success of the purification can be monitored, and,
• Economical in terms of time and material.
The extent to which the assay meets these requirements has a major bearing on the difficulty, or otherwise, likely to be experienced in the subsequent protein isolation.
Assays for enzymes are usually specific although, for example, “proteolytic activity” may not be specific enough to be very useful by itself. On the other hand, an activity like “toxicity” may not be specific and may not be due to a single component. Since a large proportion of proteins isolated are enzymes, enzyme assays will be used to illustrate some of the conceptual dimensions of assays. It must be appreciated, however, that many proteins are not enzymes and different assay methods will be required for these.
1. Enzyme assays
Enzymes are biological catalysts which speed up the rate of specific reactions. The activity of an enzyme is therefore defined, and measured, by the extent to which it speeds up a reaction.
1.1 The progress curve
The primary measurement in an enzyme assay is a progress curve, in which the amount of reaction that has taken place is plotted against time. The amount of reaction is defined as the amount of product formed or as the amount of substrate consumed. A typical progress curve, for an enzyme that is stable under the reaction conditions, is shown in Fig. 1. The velocity of the reaction is given by the slope of the progress curve. Initially, the relationship between the amount of reaction and time is linear and the slope of this linear portion gives the initial velocity (Vo). Eventually, the relationship becomes curvilinear and the reaction velocity (slope of the line) decreases, eventually reaching zero when the net reaction stops. At this point, forward and reverse reactions are in equilibrium.

Figure 1. A progress curve for an enzyme-catalyzed reaction.
The progress of an enzyme reaction may be visualized by considering the flow of water between two tanks, one initially empty and the other fairly full, with a pipe equipped with a tap connecting the two tanks at the bottom (Fig. 2).
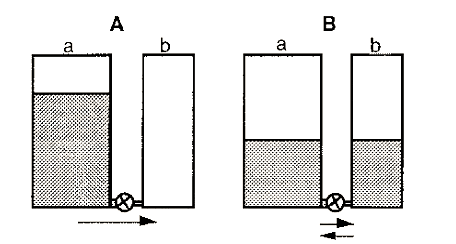
Figure 2. The water tank analogy of an enzyme-catalyzed reaction.
In this analogy the volume of water in a tank is analogous to the concentration of reactant or product and the height (potential energy) is analogous to its chemical potential. Initially (A), there is a large amount of reactant (a) but no product (b). The reaction will therefore flow to the right until equilibrium is reached. The enzyme is equivalent to the tap in this model.
1.2 The enzyme dilution curve
The initial velocity is proportional to the enzyme concentration, a relationship expressed in an enzyme dilution curve (Fig. 3). The linear enzyme dilution curve forms the basis of enzyme assays, in which the concentration of an enzyme is estimated from a measurement of its activity (i.e. from the initial velocity of the enzyme catalyzed reaction), in the presence of an excess of substrate (to ensure that a substrate limitation does not restrict the initial velocity).
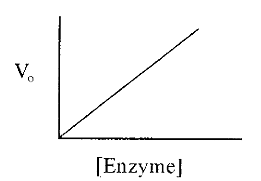
Figure 3. An enzyme dilution curve.
1.3 The substrate dilution curve
The concentration of substrate also affects the initial velocity, Vo, of an enzyme-catalyzed reaction; in the simplest case, in a manner expressed by the so-called Michaelis-Menten equation:


A plot of Vo versus [S] yields a so-called substrate dilution curve, such as shown in Fig. 4, which was calculated from the Michaelis-Menten equation, using values of Vmax = 1000 and Km = 90.
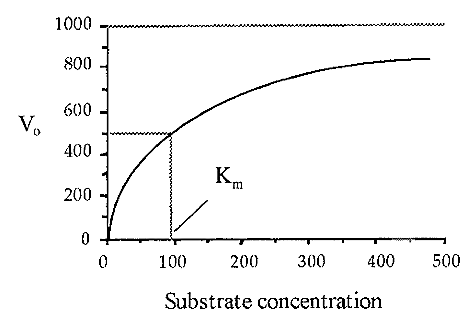
Figure 4. A substrate dilution curve.
Note: The substrate dilution curve must not be confused with the similarly-shaped progress curve. The Km, i.e. that substrate concentration which gives one half of the maximal velocity possible (at that enzyme concentration) is a constant. characteristic for a particular enzyme acting on a particular substrate. Knowledge of the Km is useful when devising an enzyme assay as it enables one to use a substrate concentration where Vo will not be too sensitive to small changes in [S] due to experimental error. A good rule-of-thumb is that [S] should be as high as possible, preferably at a level where the substrate dilution curve is asymptotic to Vmax. Often, however, [S] is constrained by cost or experimental practicability, and values of less than Km may have to be used. For example the proteinase cathepsin B is routinely assayed at [S] = 1/4 Km, using a fluorogenic substrate.
1.4 The effect of pH on enzyme activity
Another factor which influences Vo is pH, which can exert its effect in different ways; on the ionization of groups in the enzyme's active site, on the ionization of groups in the substrate, or by affecting the conformation of the either the enzyme or the substrate, These effects are manifest in changes in the kinetic constants, Km and kcat.
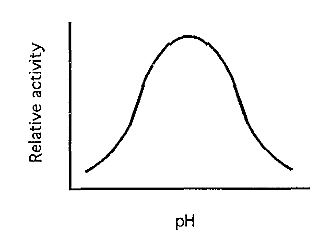
Figure 5. A typical pH-activity curve.
The net result is usually a bell-shaped pH-activity profile (Fig. 5). Vo reaches its maximum at the optimum pH, which is the pH that should be used when assaying the enzyme.
In expressing pH-activity profiles, many authors plot kcat/Km against pH. Why, and what does this mean?. For a reaction of the form:-

the initial velocity, expressed as a function of the concentrations of free enzyme [E] and substrate, is described by the equation:-


in which kcat/Km is readily recognized as a second order rate constant. kcat/Km is also known as the specificity constant as it is maximal with an optimum substrate.
Changes in pH will affect Vo, linearly, through effects on either (or both of) the enzyme's affinity for the substrate (Km) or its turnover number (kcat), but will not affect [E] or [S]. The influence of pH is, therefore, essentially on kcat/Km and kcat/Km is maximal at the pH optimum.
The practical problem is that [E], the concentration of free enzyme, is not known. In the measurements involved in establishing a pH-activity profile, the total enzyme concentration, [E]o, and the initial substrate concentration, [S]o, are constant (and known), and in the measurement of Vo it can be assumed that [S] [S]o. The concentration of free enzyme. [E], is not known but is a function of [S] and Km asdescribed by equation 3:-


[E] is thus markedly influenced by the magnitude of [S] relative to Km. The variation of [E] with Km is least when [S] is small relative to Km (Modeling of equation 3 reveals that [S] must be ≤Km/40). When this is true (and only when this is true):-
[E] ≈[E]o,
• the shape of the pH-activity profile is linearly affected by changes in kcat and/or Km, brought about by the changes in pH, and
• “relative activity” is proportional to kcat/Km. When these conditions apply:-


which means that, if it is possible to use a substrate concentration I Km/40, a pH-activity profile of kcat/Km versus pH can be constructed from measurements of Vo at different pH values and the known values of [E]o and [S].
However, it is not always practicable to use a substrate concentration of I Km/40 and when [S] is not small relative to Km, [E]≠ [E]o and the more familiar Michaelis-Menten equation applies, i.e.

In this case separate measures of kcat and Km have to be obtained in the classical way by measuring Vo at a number of levels of [S], at each pH.
The paired data can be used to obtain estimates of kcat and Km at each pH, preferably by the method of Eisenthal and Cornish-Bowden. From these, kcat/Km values can be obtained and the pH-activity profile plotted.
1.5 The effect of temperature on enzyme activity
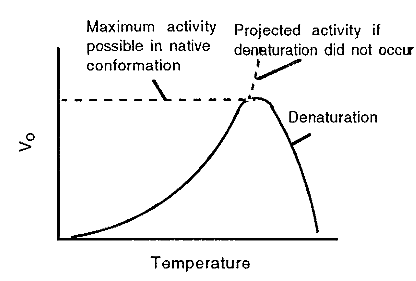
Figure 6. A typical temperature profile for an enzyme-catalyzed reaction.
Finally, temperature also influences Vo. Two effects interact to give a resultant curve. On the one hand, like all chemical reactions, the velocity of enzyme-catalyzed reactions increases with an increase in temperature, typically doubling for every 10C rise in temperature. In the case of an enzyme-catalyzed reaction, however, eventually a temperature is reached where the enzyme becomes unstable and begins to denature, at which point the reaction rate again declines. The resultant is usually an asymmetrical peak, which rises relatively slowly with an increase in temperature, and then drops rather suddenly (Fig. 6).
It must be realized that denaturation is itself a reaction, with a temperature-dependent rate constant. Denaturation is generally a first-order reaction, since each protein molecule simply unfolds, independently of interaction with any other protein molecules. A useful way of expressing the temperature stability of an enzyme is therefore to measure the half-life (t1/2) of its activity as a function of temperature. The half -life is the time taken for the enzyme activity to decrease from any value to half of that value. The half-life will be “infinite” until the temperature is reached at which the enzyme begins to denature. Thereafter, the half-life will decrease with an increase in temperature.
References
-Dennison, C. (2002). A guide to protein isolation . School of Molecular mid Cellular Biosciences, University of Natal . Kluwer Academic Publishers new york, Boston, Dordrecht, London, Moscow .
-Eisenthal, R. and Cornish-Bowden, A. (1974) The direct linear plot. A new graphical procedure for estimating enzyme kinetic parameters. Biochem. J. 139, 715-720.
 الاكثر قراءة في عزل البروتين
 اخر الاخبار
اخبار العتبة العباسية المقدسة

الآخبار الصحية


 (نوافذ).. إصدار أدبي يوثق القصص الفائزة في مسابقة الإمام العسكري (عليه السلام)
 قسم الشؤون الفكرية يصدر مجموعة قصصية بعنوان (قلوب بلا مأوى)
 قسم الشؤون الفكرية يصدر مجموعة قصصية بعنوان (قلوب بلا مأوى)


