علم الكيمياء

تاريخ الكيمياء والعلماء المشاهير
التحاضير والتجارب الكيميائية
المخاطر والوقاية في الكيمياء
اخرى
مقالات متنوعة في علم الكيمياء
كيمياء عامة
الكيمياء التحليلية
مواضيع عامة في الكيمياء التحليلية
التحليل النوعي والكمي
التحليل الآلي (الطيفي)
طرق الفصل والتنقية
الكيمياء الحياتية
مواضيع عامة في الكيمياء الحياتية
الكاربوهيدرات
الاحماض الامينية والبروتينات
الانزيمات
الدهون
الاحماض النووية
الفيتامينات والمرافقات الانزيمية
الهرمونات
الكيمياء العضوية
مواضيع عامة في الكيمياء العضوية
الهايدروكاربونات
المركبات الوسطية وميكانيكيات التفاعلات العضوية
التشخيص العضوي
تجارب وتفاعلات في الكيمياء العضوية
الكيمياء الفيزيائية
مواضيع عامة في الكيمياء الفيزيائية
الكيمياء الحرارية
حركية التفاعلات الكيميائية
الكيمياء الكهربائية
الكيمياء اللاعضوية
مواضيع عامة في الكيمياء اللاعضوية
الجدول الدوري وخواص العناصر
نظريات التآصر الكيميائي
كيمياء العناصر الانتقالية ومركباتها المعقدة
مواضيع اخرى في الكيمياء
كيمياء النانو
الكيمياء السريرية
الكيمياء الطبية والدوائية
كيمياء الاغذية والنواتج الطبيعية
الكيمياء الجنائية
الكيمياء الصناعية
البترو كيمياويات
الكيمياء الخضراء
كيمياء البيئة
كيمياء البوليمرات
مواضيع عامة في الكيمياء الصناعية
الكيمياء التناسقية
الكيمياء الاشعاعية والنووية

Mass Spectroscopy
 المؤلف:
John D. Roberts and Marjorie C. Caserio
المؤلف:
John D. Roberts and Marjorie C. Caserio
 المصدر:
Basic Principles of Organic Chemistry : LibreTexts project
المصدر:
Basic Principles of Organic Chemistry : LibreTexts project
 الجزء والصفحة:
........
الجزء والصفحة:
........
 13-1-2022
 3670
3670


+
-
20
Mass Spectroscopy
The usual application of mass spectroscopy to organic molecules involves bombardment with a beam of medium-energy electrons (5050-100eV or 1150-2300kcal mol−1) in high vacuum, and analysis of the charged particles and fragments so produced. Most mass spectrometers are set up to analyze positively charged fragments, although negative-ion mass spectrometry also is possible. The elements of a mass spectrometer are shown in Figure 9-51. The positive ions produced by electron impact are accelerated by the negatively charged accelerating plates and sweep down to the curve of the analyzer tube where they are sorted as to their mass-to-charge (m/e) ratio by the analyzing magnet. With good resolution, only the ions of a single mass number will pass through the slit and impinge on the collector, even when the mass numbers are in the neighborhood of several thousand. The populations of the whole range of mass numbers of interest can be determined by plotting the rate of ion collection as a function of the magnetic field of the analyzing magnet.

Figure 9-51: Schematic diagram of a mass spectrometer.
Mass spectra of 2-propanone, 2-butanone, and propanal are shown in Figure 9-52. Each peak represents ions of particular masses formed as the result of fragmentation of the molecule produced by electron impact into CH3+,CH3CH2+, CH3CO⊕, and so on. The "cracking patterns" are, of course, functions of the energy of the bombarding electrons and serve as an extraordinarily individual fingerprint of the particular molecules. For instance, 2-propanone and propanal are isomers, yet their cracking patterns are strikingly different.

Figure 9-52: The mass spectra of (a) 2-butanone, (b) propanal, and (c) 2-propanone. These spectra were supplied through the courtesy of Dr. D. P. Stevenson of the Shell Development Company.
The peak that is highest in mass number is of considerable importance because it corresponds to the parent molecule M minus one electron (designated as M+) and provides a highly accurate method for measuring molecular weights. Incorrect molecular weights will be obtained if the positive ion, M+, becomes fragmented before it reaches the collector, or if two fragments combine to give a fragment heavier than M+. The peak of M+ is especially weak with alcohols and branched-chain hydrocarbons, which readily undergo fragmentation by loss of water or side-chain groups. With such compounds the peak corresponding to M+ may be 0.1% or less of the highest peak in the spectrum, which is called the base peak and usually is assigned an arbitrary intensity of 100.
The pressure of the sample in the ion source of a mass spectrometer is usually about 10−5mm10−5mm, and, under these conditions, buildup of fragments to give significant peaks with m/em/e greater than M+ is rare. One exception to this is the formation of (M+1)+ peaks resulting from transfer of a hydrogen atom from MM to M+. The relative intensities of such (M+1)+ peaks are usually sensitive to the sample pressure and may be identified in this way.
With the molecular weight available from the M+ peak with reasonable certainty, the next step is to determine the molecular formula. If the resolution of the instrument is sufficiently high, quite exact masses can be measured, which means that ions with m/em/e values differing by one part in 50,000 can be distinguished. At this resolution it is possible to determine the elemental composition of each ion from its exact m/e value.
Many mass spectrometers in routine use are incapable of resolving ions with m/em/e values that differ by less than one mass unit. In this event, the determination of elemental composition can be determined by the method of isotope abundance. We will illustrate this with the following simple example.
The highest peaks corresponding to M+ in the mass spectrum of an unknown sample have m/em/e equal to 64 and 66 with relative intensities of 3:1. What is the elemental composition? The 3:1 abundance ratio is uniquely characteristic of the chlorine isotopes, Cl35:Cl37= 3:1. The mass peaks at 64 and 66 are therefore both molecular ions; the 64 peak is of an ion containing Cl35 and the 66 peak is of an ion containing Cl37. The remaining atoms in the molecule must add up to (64−35)=29, or (66−37)=29 mass units. There are several possible combinations of CC, HH, NN, and OO that give mass 29; they are N2H, CHO, CH3N, and C2H5. Of these, the combination with ClCl that makes the most chemical sense is C2H5, and the formula of the molecule therefore is C2H5Cl, chloroethane.
This example illustrates how m/em/e values of ions that differ only in isotopic composition can be used to determine elemental compositions. The important isotopes for this purpose in addition to those of chlorine are the stable isotopes of natural abundance, C13 (1.1%), N15 (0.37%), O17 (0.04%), and O18 (0.20%). As a further example, suppose that we have isolated a hydrocarbon and have determine from its mass spectrum that M+= 86 mass units. In the absence of any combination reactions there will be an (M+1)+ ion corresponding to the same molecular ion but with one C13 ion in place of C12. The intensity ratio (M+1)+/M+ will depend on the number of carbon atoms present, because the more carbons there are the greater the probability will be that one of them is C13. The greater the probability, the larger the (M+1)+/M+ ratio. For nn carbons, we expect

The only hydrocarbon formula with M+= 86 and n=6 is C6H14.
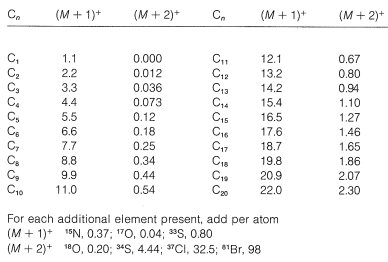
Nitrogen as(N15as(N15) and oxygen (as O17) also contribute to (M+1)+, if present, while O18O18 and two C13C13's contribute to (M+2)+. The calculated intensities of (M+1)+ and (M+2)+ relative to M+ (as 100) are tabulated in Table 9-5 for elemental composition of ions up to C20C20. The table applies to fragment ions as well as molecular ions, but the intensity data from fragment ions very often is complicated by overlapping peaks.
Table 9-5: Isotopic Contributions for Carbon and other Elements to Intensities of (M+1)+ and (M+2)+ relative to M+(100)
The next step in the analysis of a mass spectrum is to see what clues as to structure can be obtained from the fragment ions. It would be a serious error to imagine that in mass spectra nothing is observed but simple nonspecific fragmentation of organic molecules on electron impact. Actually, even though electron impact produces highly unstable molecular ions, there is a strong tendency for breakdown to occur by reasonable chemical processes, and this may involve straightforward fragmentation or rearrangement of atoms from one part of the molecule to another.
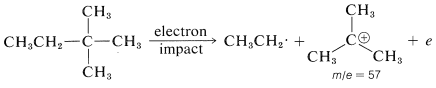
In general, fragmentation occurs at the weakest bonds, and the most abundant fragments also are the most stable ones. For instance, hydrocarbons fragment preferentially at branch points, partly because the C−C bonds are weaker here than elsewhere along the chain, and partly because the ionic fragments are more stable. As an example, consider 2,2-dimethylbutane. There is no molecular ion evident in its mass spectrum because it cleaves so readily at the quaternary carbon to give the m/e 57 peak corresponding to the most abundant fragment ion. This ion is presumably the tert-butyl cation and the alternate cleavage to the less stable ethyl cation with m/e= 29 is much less significant.
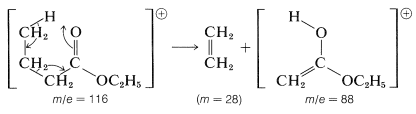
An excellent example of a rearrangement with fragmentation is provided by the M+ ion of ethyl butanoate, which breaks down to give ethene and the M+ ion of an isomer of ethyl ethanoate called its "enol form".
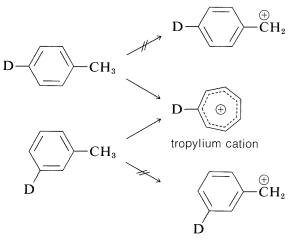
An interesting and complex rearrangement occurs on electron impact with methylbenzene (toluene). An intense peak is observed having m/em/e for C7H7+, but the ion involved appears to be a symmetrical C7H7+ ion, rather than a phenylmethyl cation. The evidence for this is that the fragmentation patterns found in the mass spectrometry of the ion itself are the same, no matter which of the monodeuteriomethylbenzenes is used as starting material. This rearrangement occurs because of the high delocalization energy of the symmetrical ceC7H7⊕ ion (usually called "tropylium cation") and because its charge is spread out more evenly over the carbons than would be the charge for the phenylmethyl cation .
Tabulations of elemental compositions of C, H, N and O for mass values up to 250 are listed in many texts on mass spectrometry. Consult these tables to see all possible alternatives. See also J. H. Beynon, Mass Spectrometry and its Applications to Organic Chemistry, Elsevier Publishing Co., Amsterdam, 1960.
 الاكثر قراءة في التشخيص العضوي
 اخر الاخبار
اخبار العتبة العباسية المقدسة

الآخبار الصحية


مواضيع ذات صلة
 قسم الشؤون الفكرية يصدر كتاباً يوثق تاريخ السدانة في العتبة العباسية المقدسة
 "المهمة".. إصدار قصصي يوثّق القصص الفائزة في مسابقة فتوى الدفاع المقدسة للقصة القصيرة
 (نوافذ).. إصدار أدبي يوثق القصص الفائزة في مسابقة الإمام العسكري (عليه السلام)