Water
Figure 4.5 is the phase diagram for water. The liquid–vapour boundary in the phase diagram summarizes how the vapour pressure of liquid water varies with tempera ture. It also summarizes how the boiling temperature varies with pressure: we simply read off the temperature at which the vapour pressure is equal to the prevailing atmospheric pressure. The solid–liquid boundary shows how the melting tempera ture varies with the pressure. Its very steep slope indicates that enormous pressures are needed to bring about significant changes. Notice that the line has a negative slope up to 2 kbar, which means that the melting temperature falls as the pressure is raised. The reason for this almost unique behaviour can be traced to the decrease in volume that occurs on melting, and hence it being more favourable for the solid to transform into the liquid as the pressure is raised. The decrease in volume is a result of the very
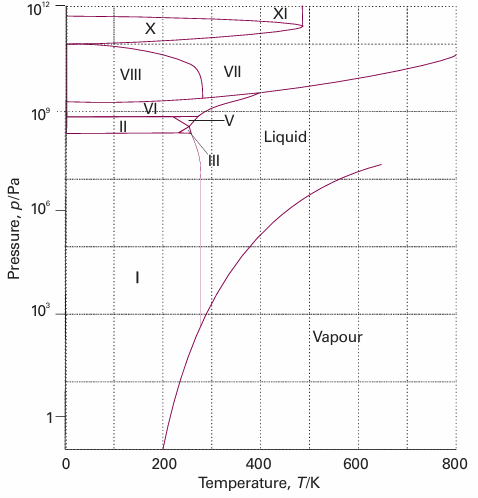
Fig. 4.5The experimental phase diagram for water showing the different solid phases.
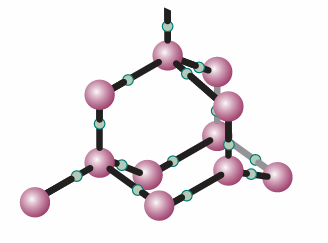
Fig. 4.6A fragment of the structure of ice (ice-I). Each O atom is linked by two covalent bonds to H atoms and by two hydrogen bonds to a neighbouring O atom, in a tetrahedral array.
open molecular structure of ice: as shown in Fig 4.6, the water molecules are held apart, as well as together, by the hydrogen bonds between them but the structure partially collapses on melting and the liquid is denser than the solid. Figure 4.5 shows that water has one liquid phase but many different solid phases other than ordinary ice (‘ice I’, shown in Fig. 4.5). Some of these phases melt at high temperatures. Ice VII, for instance, melts at 100°C but exists only above 25 kbar. Note that five more triple points occur in the diagram other than the one where vapour, liquid, and ice I coexist. Each one occurs at a definite pressure and temperature that cannot be changed. The solid phases of ice differ in the arrangement of the water molecules: under the influence of very high pressures, hydrogen bonds buckle and the H2O molecules adopt different arrangements. These polymorphs, or different solid phases, of ice may be responsible for the advance of glaciers, for ice at the bottom of glaciers experiences very high pressures where it rests on jagged rocks.


